By Richard Flax, Chief Investment Officer at Moneyfarm
It doesn’t feel great at the moment. Inflation is high, growth is low and there’s a general sense that nothing is really working – not the NHS, not VAR. But is that a fair conclusion? We wanted to dig into the data a little bit.
First, on the economy. It’s tough to disagree with the assertion that growth is slow. The chart below paints a picture of near stagnation.
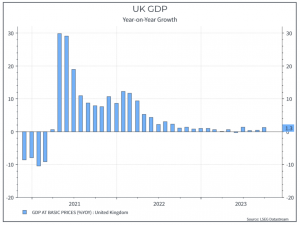
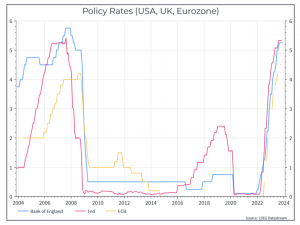
But should we be surprised? After all, policy rates have risen pretty quickly. You could argue that the real surprise is that the economy isn’t shrinking in the face of such a move.
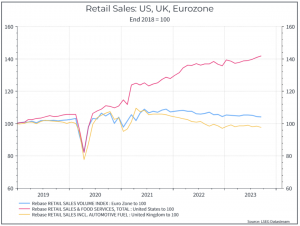
What about compared to other countries? The chart below shows retail sales in the US, the UK and the Eurozone since the end of 2018. The real outlier here is the US, where consumer spending has held up extremely well in the face of higher rates. The UK and the Eurozone don’t look wildly different, even if the UK lags.
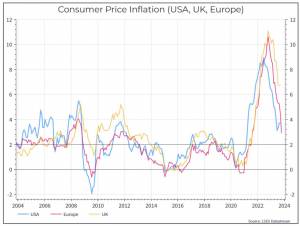
Let’s turn to inflation. Here the story is a bit clearer. Inflation is coming down in the UK, but at a slower pace than in the US and the Eurozone. That probably means UK households will feel the pain of higher prices and higher rates for longer than their peers in the Eurozone and the US.
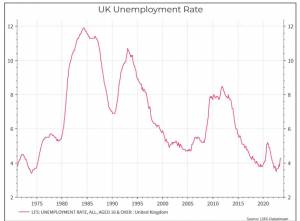
Let’s turn to the labour market. On the surface, the news is a bit better here. UK unemployment is low versus history, even if we’ve seen it tick up in recent months.
So there are jobs available, but what about wages? The chart below shows actual wage growth year-on-year (the blue line). That looks pretty good for households – it’s currently still in the mid to high single digits. The yellow line compares wage growth to inflation. That looks less good – even if wage growth when adjusted for inflation has made its way back to zero, workers are still worse off in real terms than they were three years ago. That’s true for workers across the world, but that’s probably scant compensation for the UK household.
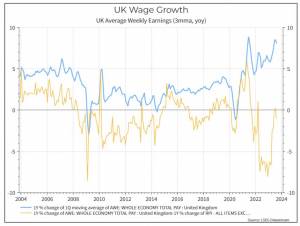
So the current picture looks mixed – slow growth, still high inflation but decent wage growth and still pretty low unemployment. It’s not great, but it could be worse.
But from a secular perspective there are a couple of considerations.
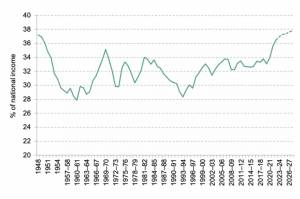
First, let’s look at tax revenues. As the Institute for Fiscal Studies has noted, tax revenues as a percentage of GDP are at their highest in decades and look set to rise further (as the chart below shows). That might be fine if the population believed that the state services were working well, but from what we can tell that’s not the case. The counter-argument is that while tax revenues as a percentage of GDP are high versus history, they’re not particularly high compared to other countries. The G7 average, for instance, has historically been some way above the UK. But the prospect of raising tax revenue even higher might not appeal to the hard-pressed UK taxpayer.
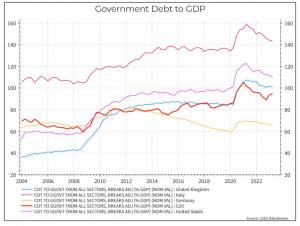
Second, we should talk about debt levels. The chart below shows government debt as a percentage of GDP. UK debt to GDP has risen steadily since the early 2000s, first as a result of the Global Financial Crisis and then as a consequence of COVID spending. But that’s generally been true across the Developed World. Only Germany, on this chart, has really been able to buck the trend. The challenge here is that interest expenses for much of this period were very low. With bond yields now far higher than they were, governments will be spending far more on interest than they did. The cost of running a deficit is rising. The fact that Italy or the US might be in a more difficult position (from the perspective of debt to GDP) might not be much consolation.
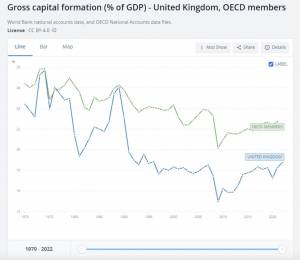
Finally, we should touch on investment. One way to improve your debt ratios is to grow faster. And increasing your investment spending is usually regarded as a good way of raising a countries sustainable growth rate. In this regard, the UK has been a disappointment. The chart below shows overall investment spending as a percentage of GDP. The UK has consistently lagged behind the OECD average (according to World Bank data). That doesn’t bode well for hopes of accelerating economic growth.
So, where does this end up? The UK economy clearly faces challenges. Growth is slow, inflation remains stubbornly high and investment spending isn’t where it should be. In terms of inflation and investment spending, we’d argue the UK is underperforming compared to its peers. But in some respects the fundamental challenge isn’t that the UK looks worse than many of its peers, but that it doesn’t. Much of the developed world faces similar challenges and that’s likely to make life more complicated for policymakers and households in the years to come.
 Richard Flax: Richard is the Chief Investment Officer at Moneyfarm. He joined the company in 2016. He is responsible for all aspects of portfolio management and portfolio construction. Prior to joining Moneyfarm, Richard worked in London as an equity analyst and portfolio manager at PIMCO and Goldman Sachs Asset Management, and as a fixed income analyst at Fleming Asset Management. Richard began his career in finance in the mid-1990s in the global economics team at Morgan Stanley in New York. He has a BA from Cambridge University in History, an MA from Johns Hopkins University in International Relations and Economics, and an MBA from Columbia University Graduate School of Business. He is a CFA charterholder.
*As with all investing, financial instruments involve inherent risks, including loss of capital, market fluctuations and liquidity risk. Past performance is no guarantee of future results. It is important to consider your risk tolerance and investment objectives before proceeding.


