





September is usually Bitcoin’s weakest month, as seasonality cross assets is weak, and this one started with plenty of reasons for caution. The Federal Reserve (Fed) was preparing to raise rates, US government bond yields were at their highest in two decades and a crypto bill was heading for a difficult Senate vote.
Bitcoin still closed the month up about 6.4% at around $83,600, ending its best third quarter since 2017. Early October has been less kind. Bitcoin failed to break above $87,000 in the first week, then fell to around $80,000 in mid-month after higher-than-expected inflation figures. It has since settled at $82,000–83,000, about 3% lower for the month and still around 7% down for the year.
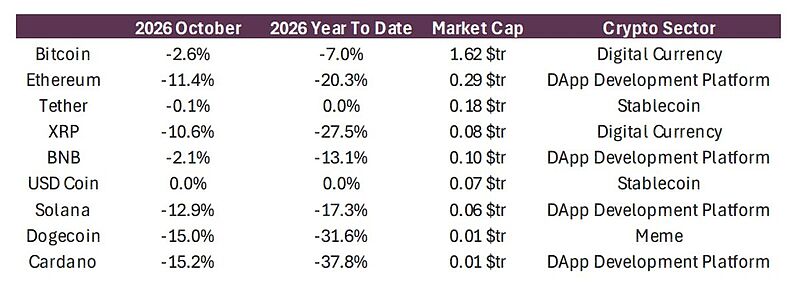
The path through September matters more than where it ended. Bitcoin touched its low for the month, about $74,900, on 15 September, the day the CLARITY Act – a bill aimed at establishing clearer rules for the US crypto market – failed in the Senate and the day before the Fed’s rate hike. Within a week it had reached $87,400. Part of the rise again came from investors who had bet against Bitcoin being forced to close those bets: around $650 million of these “short” positions were liquidated on 21 September alone. Real buying played a part too, with US spot Bitcoin ETFs – funds that invest directly in Bitcoin – taking in money on nine consecutive days between 17 and 29 September.
Within crypto, September favoured the more volatile assets. Ether rose about 9% and climbed above $2,700 for the first time since January, while Solana gained around 15% to a seven-month high. Much of the gain was concentrated in a few specific stories, such as tokens linked to Artificial Intelligence. October has partly reversed this. Ether has lost around 11% so far this month, and Bitcoin’s share of the total crypto market is back near 60%, usually a sign that investors are turning more defensive.
The macro moment
Inflation is still the dominant theme. On 16 September the Fed raised rates by 25 basis points to 3.75-4%, its first increase since 2023, and Fed Chair Kevin Warsh said inflation “is too high, and has been for too long”. The minutes of the meeting showed that most officials expect another rise before the end of the year.
The data since then have pointed both ways. The Fed’s preferred inflation measure for August came in below expectations. September consumer and producer prices, however, rose more than expected, and households’ inflation expectations for the year ahead reached 4.7%. Markets now see a December rise as more likely than a move at the 27–28 October meeting. Oil adds to the pressure, with Brent close to $110 a barrel after renewed tension in the Strait of Hormuz.
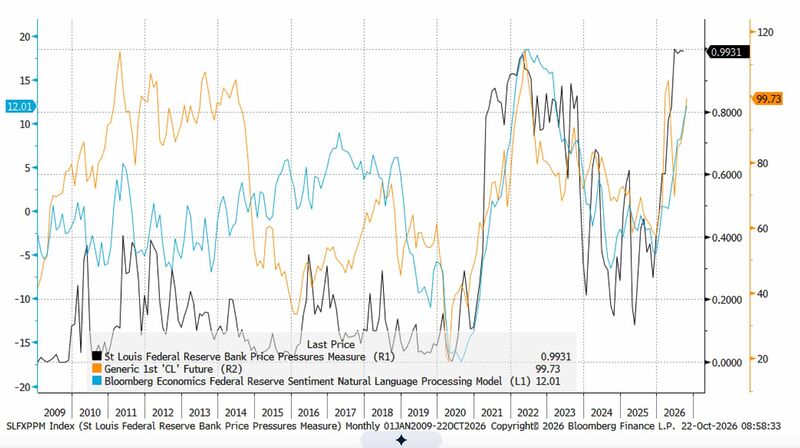
The chart compares three indicators from 2009 to today: the oil price (orange line), the probability estimated by the St. Louis Fed that US inflation will exceed 2.5% over the next twelve months (black line), and the “tone” of Federal Reserve communications as measured by Bloomberg (light blue line; higher values indicate a more restrictive stance).
The three lines tend to move in a similar direction. As in 2021–2022, the rise in oil prices in 2026 – now close to $100 a barrel – has been accompanied by growing price pressures. According to the St. Louis Fed indicator, the probability of inflation remaining above 2.5% is now close to 100%. At the same time, the Fed’s language has become more focused on tackling inflation, although it has not reached the levels seen in 2022.
As in previous months, one of the key factors to watch is how the Fed and the US Treasury work together to contain tensions in the bond market. While the Fed acts mainly through interest rates, the Treasury can intervene directly in the government bond market. Since the beginning of September, it has carried out three larger-than-usual buybacks of long-dated bonds: by purchasing these bonds, it supports demand and can help limit the rise in their yields. Treasury Secretary Scott Bessent has also said that he will intervene if yields continue to rise. Markets have started referring to this kind of “safety net” as the Bessent put. So far the effect has been limited. The 10-year yield reached around 5.37% in early October, its highest since 2002. The Fed’s own minutes noted that uncertainty about the buyback programme had raised the extra return investors demand to hold long-dated bonds.
Meanwhile, the Fed paused its regular purchases of short-term Treasury bills in September. Put together, the Fed is tightening and no longer buying bills, while the Treasury is issuing more bills to pay for its buybacks. That drains some liquidity from the financial system, which does not help Bitcoin. The picture would change if the Treasury used its cash reserves to fund larger buybacks, or if the Fed restarted its bill purchases, since either would add liquidity. On the other hand, another rate rise and a stronger dollar would keep real yields high and increase the cost of holding an asset that pays no income.
Bitcoin’s correlations with other assets have shifted as a result. In August, Bitcoin moved closely with gold as part of a trade against US fiscal risk. In September the two parted ways: gold fell more than 6% while Bitcoin rose. Over the same month, Bitcoin’s correlation with US equities rose from close to zero to around 0.5. In mid-October, Bitcoin slipped towards $80,000 in the same week the Nasdaq fell 4.5% on doubts about how long AI spending can last, although Bitcoin fell much less. The usual caveat applies: macroeconomic factors explain only part of Bitcoin’s behaviour. Still, a closer link with equities is worth watching, because it weakens Bitcoin’s role as a diversifier.
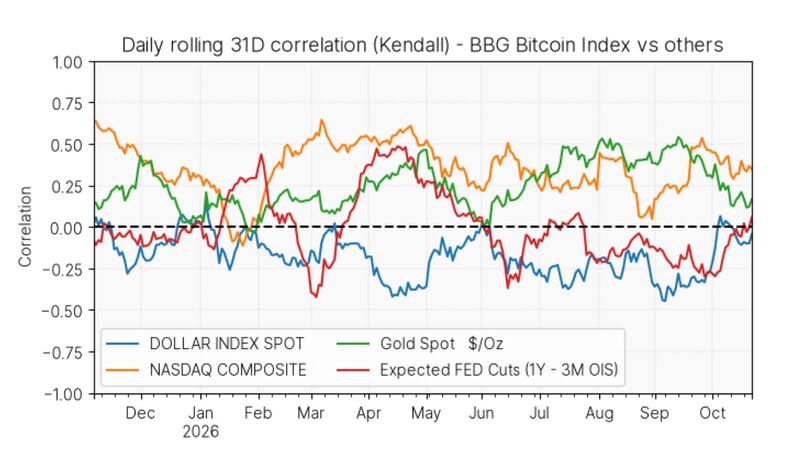
Source: Moneyfarm analysis based on data from Bloomberg.
On regulation, the CLARITY Act failed a procedural vote in the Senate on 15 September, well short of the 60 votes it needed. Bitcoin fell about 4% that day but recovered within a week. Congress is in recess until after the 3 November midterm elections, so the bill’s best remaining chance is the short session before the new Congress sits.
In the meantime the regulators have kept moving. The SEC, the US financial markets regulator, has proposed new rules for crypto offerings and custody, plus a five-year exemption for platforms trading tokenised securities.
Outside the US, the UK has opened applications for its new crypto regime and the EU has tightened supervision of stablecoins.
A more immediate risk concerns companies that hold Bitcoin on their balance sheets. Index provider MSCI has finalised rules that could remove companies whose main activity is holding digital assets from its indices, with a list due on 11 November. Strategy, the largest corporate holder, could be affected, with estimates of up to $2.8 billion in outflows from funds that track those indices.
The flows
Flows into US Bitcoin ETFs stayed strong in September at around $2.65 billion, after $3.5 billion in August, and turned positive for the year. Ether ETFs added $832 million. October has been weaker. Bitcoin ETFs are roughly flat for the month after a run of outflows, while Ether ETFs have lost about $1.1 billion, their worst month of the year.
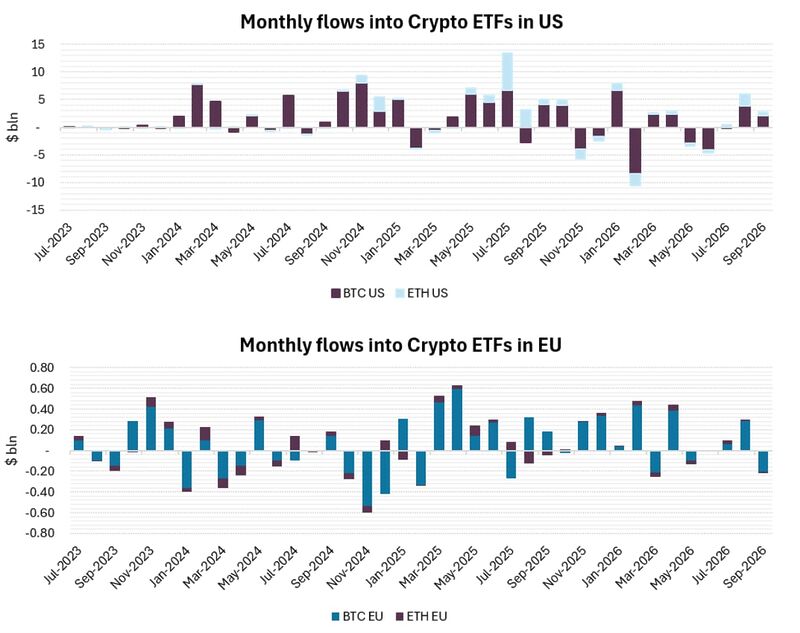
Source: Moneyfarm analysis based on data from Bloomberg.
Taken together, the period shows Bitcoin rising through a rate hike, a failed crypto bill and higher yields, helped by steady ETF buying. Early October has shown the limits of that resilience, as the dollar strengthened, inflation surprised and equities wobbled. Some tests now arrive close together, including the US midterms on 3 November and MSCI’s list on 11 November. It is too early to say whether the summer recovery marks a lasting change. How the Fed and the Treasury handle long-term yields is likely to matter most for what comes next.
Investing in Crypto involves a high level of risk. You should not invest unless you are prepared to lose all of the money you invest. The value of your investments can go down as well as up, and you may get back less than you invest. You may not be protected if something goes wrong. Past performance is not a reliable indicator of future results. The views expressed here do not constitute a recommendation, advice or forecast. If you are unsure whether investing is right for you, please seek independent financial advice.
*As with all investing, financial instruments involve inherent risks, including loss of capital, market fluctuations and liquidity risk. Past performance is no guarantee of future results. It is important to consider your risk tolerance and investment objectives before proceeding.