





Major listings, like the recent SpaceX’s IPO, can absorb market liquidity and influence broader markets. Our special contributor and Daily Telegraph columnist David Stevenson explores what that means for investors’ portfolios.
SpaceX’s IPO has prompted many investors to consider the impact of mega listings on their portfolios. And of course, SpaceX is just the first of three giants – we should expect IPOs from Anthropic and OpenAI, which, when including Alphabet’s recent stock issue, could mean that new equity issuance in the US surpasses $330bn and proves a drain on liquidity. Markets will also have to navigate the release of $800bn in SpaceX shares from lock-up between now and the end of November. What impact will all this have on your portfolio and wider markets?
One useful way to think about the impact of IPOs on your portfolio is to consider the stock-and-flow concept used by economists. Most commentary on IPOs, and in fact markets generally, tends to focus on ‘stock’ issues, i.e. looking at existing assets and making a judgement about, say, the relative ‘value’ of the market cap versus earnings. But markets are adaptive and constantly churning, and it’s sometimes better to look at the ‘flow’ side of the equation, i.e. how liquidity changes over time.
As we work our way through the various challenges – and opportunities – presented by IPOs, bear in mind this important distinction. In simple terms, think less about whether an IPO is ‘cheap’ or not, and think rather about its impact on the wider market and liquidity. That stock-and-flow framework is useful when thinking through the big questions, such as the timing of lockups for SpaceX, how the Mag7 stocks reacted to the IPO, and the general decline in stock market listings and the increase in share buybacks.
The SpaceX IPO – diminishing returns
Let’s start with the elephant in the room, or should we say rocket – SpaceX. The IPO was priced at $135 per share on 11 June 2026, with the stock commencing trading on the Nasdaq on 12 June 2026 under the ticker SPCX. The company sold 555.6 million shares of Class A common stock at IPO, implying a valuation of approximately $1.75–1.77 trillion. On 15 June, underwriters Goldman Sachs and Morgan Stanley exercised the full greenshoe (overallotment) option, purchasing an additional 83.3 million shares, bringing total IPO proceeds to $85.7 billion and smashing the previous record set by Saudi Aramco’s $29.4 billion listing in 2019.
One way of judging its popularity is the level of oversubscription, i.e how much demand exceeded the supply of shares in this event. Most reports suggest the issue was at least two times oversubscribed, although Reuters put the eventual demand at above $250 billion, with demand running at three and a half to four times oversubscribed, with multiple institutional investors each placing orders of about $10 billion or more. A 4x oversubscription may sound exceptional, but it is actually modest compared to a typical smaller-scale mega-tech IPOs.
Subsequently, the share price shot up, as is also normal for many US IPOs: there was a to-be-expected first-few-days pop, a spike, a sharp correction, then a partial recovery. It was priced at $135, opened at $150 and closed on day one at $160.95, a 19% first-day gain. It then ran to an all-time high of $225.64 on 16 June before rolling over to an all-time low of $147.11 on 23 June, a roughly 33% fall from the peak in a week. As of 1 July, SpaceX shares were trading around $170.86, with a 52-week range of $135 to $225.64, putting the market cap near $2.16 trillion, representing a 27% gain from the IPO price but 24.3% below the all-time high.
But it’s also worth bearing in mind that this IPO is just the beginning of an extended liquidity process – only around 4% of the total SpaceX share base was issued, with a vastly greater quantum of shares ‘locked up’, i.e the owners can’t sell until a later date.
According to most reports, SpaceX implemented a staggered lockup rather than a single standard 180-day period. SpaceX’s scheduled Q2 earnings release is 6 August 2026. This means the first meaningful selling event for insiders could materialise in early-to-mid August, with market participants likely to watch closely for any indication of institutional selling pressure from the c.20% early unlock. The more standard 180-day lock-up period ends in early December, while Elon Musk has a longer lock-in date through to 12 June 2027. Watch these dates to see whether a flood of SpaceX shares hits the market, possibly pushing the share price down.
The SpaceX IPO impact
Stepping back from the minutiae of the SpaceX IPO, the first big question is whether the IPO’s sheer scale had much direct impact on wider market liquidity.
Put simply, did investors have to sell many other stocks, especially Mag7 stocks, to free up cash to invest in this IPO (and presumably later AI IPOs such as Anthropic)?
We can piece together bits of evidence suggesting there was an impact on the wider market, but arguably not as large as some had feared. A note from analysts at JPMorgan, for instance, argued that hedge funds trimmed exposure to the largest US technology names, with some establishing short positions, while Vanda Research recorded the longest retail net-selling streak since March 2020, with Monday outflows the deepest since November 2023.
It wasn’t difficult to miss the fact that the Roundhill Magnificent Seven ETF – an ETF that tracks only the Mag7 – lost more than 2.4% over the week from 5 June. In the week before the IPO (week of 9th June), all seven Magnificent Seven stocks fell. The declines included Tesla (−9.94%), Meta (−9.02%), Nvidia (−8.34%), Microsoft (−7.17%), Amazon (−6.22%), Alphabet (−4.25%), and Apple (−6.31%). The Nasdaq QQQ ETF fell 6.8% in its worst weekly performance since April 2025. The estimated total loss in the tech sector market cap exceeded $1 trillion in that five-day window.
But the June sell-off was not purely a SpaceX event. It was triggered by Broadcom’s Q2 results on 3 June, which beat but did not raise the AI chip forecast, and a stronger-than-expected May jobs report on 5 June, which pushed yields up and sent the Nasdaq down. One could argue that SpaceX amplified an existing move rather than starting it.
It’s also worth noting that the SpaceX liquidity draw was smaller than the headlines imply. The $75 billion raise is roughly 1% of the $8 trillion sitting in US money market funds. Looking ahead, the risk is that OpenAI and Anthropic have both filed, and together the three represent more than $3.5 trillion in private-market value, so a liquidity squeeze could still occur.
One side point on crypto: Bitcoin also came under selling pressure as institutions trimmed their digital asset holdings to free up capital for SpaceX allocations.
Equity benchmark indices and SpaceX
What about the impact on your portfolios? The single most consequential transmission channel impacting your portfolio is the inclusion of SpaceX (and other IPOs) in a global or US equity benchmark index, which then ends up in your global (or US) equity index tracker fund or ETF. Here, the impact has been subtler and depends heavily on your chosen index.
The S&P 500 said no. S&P Global declined to change its entry requirements due to SpaceX’s profitability – the index firm won’t include SpaceX until the company demonstrates GAAP profitability and completes 12 months of public trading.
By contrast, most other index firms moved fast to include SpaceX. It became a member of the Russell 1000 and Russell 3000 at the June reconstitution under FTSE Russell’s new five-day fast-entry rule. It also joined the Nasdaq-100 on 7 July.
MSCI and CRSP (the latter is used by Vanguard) added it on parallel fast tracks. Looking at weight, Vanguard has said that the weight will initially be based on about 5% of shares being available, so it represents a tiny share of the index.
As for near-term mechanical buying, it is estimated at $22 to $27 billion across Russell and MSCI trackers, with the Nasdaq-100 add worth roughly $4.3bn. As analysts at Morningstar observe, SpaceX will not supplant Nvidia, Apple or Microsoft at the top of the indices anytime soon, because its limited float will not allow it, though its weight will climb as the float grows toward a possible 30% after a year. J.P. Morgan’s analysts have estimated that SpaceX’s inclusion in the Nasdaq-100 will drive approximately $4.3 billion in passive inflows, representing roughly 4% of the existing public float.
One way the SpaceX IPO has materially affected the broader markets is by heightening concentration concerns. Bank of America strategist Michael Hartnett warned in his Flow Show report (22 May 2026) that if SpaceX, OpenAI, and Anthropic were all to list and join what he terms the “AI Big 10” (the Magnificent Seven plus Broadcom, AMD, and Micron), the resulting cohort would account for approximately 47–48% of S&P 500 market capitalisation, approaching 1880s railroad-era concentration levels. As of mid-June 2026, AI-related stocks across direct AI, AI utilities, and AI capital equipment already account for approximately 49% of the S&P 500 by market cap, according to Bianco Research analysis. The S&P 500’s top 10 stocks already represented 38% of the index’s market cap ahead of the IPO, up from roughly 25% five years ago.
The bigger picture: fewer companies listed and increased buybacks
There is a broader debate about IPOs and stock markets that goes back to my stock-and-flow argument. IPOs add to the stock of listings, and they evidently do impact flow and liquidity – as we’ve already discussed, it’s entirely possible that the sheer size of the SpaceX float did have a liquidity impact on similar tech stocks. But these numbers are rather modest when you consider the much more profound forces shaping the markets.
Two stand out. The first is that share buybacks are incredibly important in helping to underwrite stock flows; i.e., the sheer quantum of stock purchases by corporates reduces overall market liquidity and narrows the supply of stocks against the constantly growing demand from ETFs and index-tracking funds.
The second force is that the sheer stock of listings has been declining globally. In simple terms, the number of listed stocks has been constantly declining in the developed world for many decades – as has the total available pool of securities once we deduct the wall of constant buybacks. Let’s take each of these forces in turn.
Buybacks have been running at a record pace in recent years, although there are some worrying signs of a slowdown in the tech sector. In the all-important US market, total S&P 500 buybacks in 2025 surpassed $1 trillion, a historic milestone. 2026 opened even hotter: companies announced $665 billion in planned repurchases in the four months through April, the most ever to start a year, helped by Apple greenlighting another $100 billion plan.
Goldman Sachs forecasts total 2026 US buybacks of $1.3 trillion in completed repurchases, with announced authorisations already at $860 billion year-to-date as of May 2026, itself a record. Ben Snider and team at GS have projected 2026 net equity supply could be flat or even negative i.e., buybacks ($1.3 trillion) exceeding total equity issuance ($1.1 trillion, including SpaceX and other large IPOs), providing a structural demand tailwind for equities.
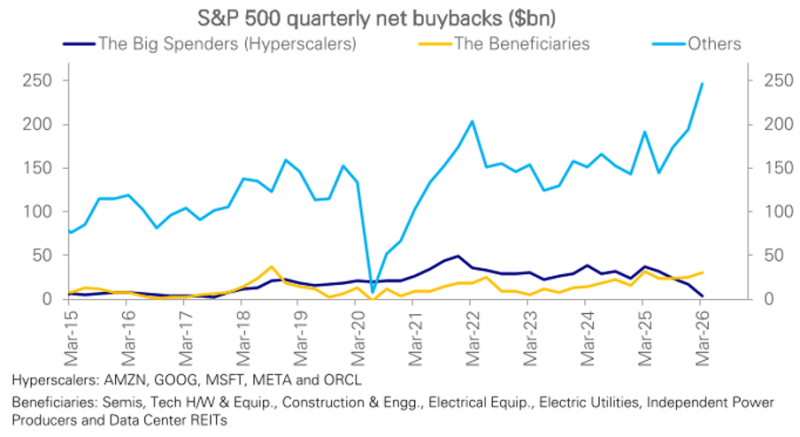
Looking at the tech sector especially, there’s another concern: capex on AI is shooting up, crimping the available liquidity to fund buybacks by the Mag7 (traditionally a big source of IPO demand). But even this concern is overblown, according to Deutsche Bank analysts: they argue that although capex is clearly surging, it has been driven by a very narrow group of big spenders.
“They are indeed slashing buybacks as well as raising additional capital. But offsetting that, companies whose earnings benefit directly from this capex are raising their buybacks, as is the rest of the S&P 500 which accounts for the bulk of earnings and buybacks. Indeed, S&P 500 net buybacks rose to a record in Q1, in keeping with record earnings, their most important driver”.
A shallower pool of stocks
Another major driver worth keeping a beady eye on is the constant decline in the number of listed companies globally. In the US, public stock market listings peaked in the mid-1990s at nearly 8,000 and have fallen by about half over the past two decades, stabilising since 2008 at roughly 4,400 domestic companies. The Wilshire 5000 index, launched in 1974 to capture virtually all US stocks, now contains only approximately 3,600 equities. Interestingly, the total number of IPOs in the US has also contracted dramatically: 677 in 1996 vs. 133 in 2016 (excluding the 2020–21 SPAC surge).
Globally, the picture is similar: a net reduction of $120 billion in public equities in one recent year, dwarfing the prior year’s $40 billion and marking a third consecutive year of decline, driven by buybacks staying stable while share IPOs fell. The UK is the starkest case, with the London Stock Exchange main market down nearly 75% in sheer numbers of companies listed between the 1960s and the end of 2022, and Germany down more than 40% since 2007. It’s also worth noting that, despite the fanfare surrounding the huge AI IPOs, US IPOs averaged over 300 a year from 1980 to 2000, but have averaged fewer than 100 since those heady days.
The numbers are a bit hazy, but some reports suggest that, as of the end of 2024, there were approximately 44,000 listed companies globally, with a total market capitalisation of $125 trillion, and that since 2005, more than 35,000 companies have been delisted globally. Ironically, although the annualised rate of decline in the number of firms in the US and Europe has been running at about 2% per annum, non-developed world markets are showing an increase in the number of stocks.
Asia now hosts more than half the world’s listed companies by count.
The rise of thematic ETFs
As for the drivers of the decline of listed companies in the developed world, it doesn’t take a genius to work out what might be happening. Look at high levels of M&A activity, lots of take-private deals by private equity, companies staying private longer, high IPO costs for smaller companies, and the growth of passive, index-tracking funds, which tend to be less exposed to small, new companies.
Whatever the drivers behind this decline, they stand in stark contrast to one statistic that nicely sums up the current situation: Dr Torsten Slok, Chief Economist at Apollo, recently observed that there are now more ETFs than US stocks.
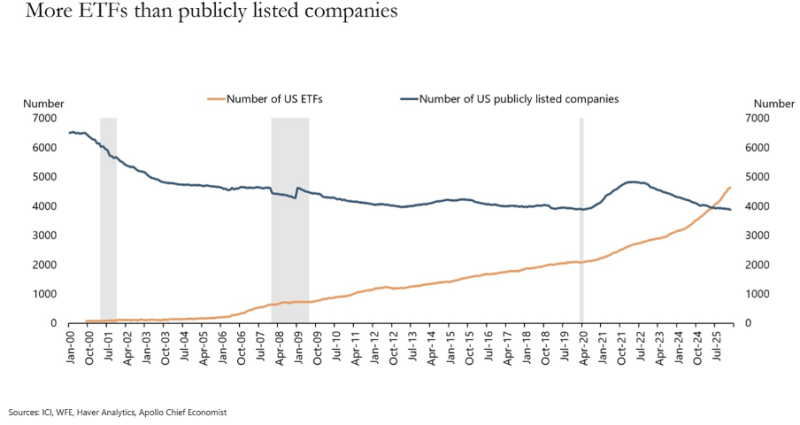
This last data point raises one very interesting question: are thematic ETFs warping markets? The chart from Apollo almost certainly includes a large and constantly growing number of thematic or trend-based ETFs, as well as a surge in single-stock or single-sector short and leveraged ETFs. One can invest in SpaceX with 1- to 3x upside and downside leverage, as well as a growing number of space-themed ETFs, plus an even larger number of tech sector trackers and, of course, a long line of Nasdaq trackers (which will include SpaceX).
The variance between the number of listed companies and the number of ETFs tracking them suggests a classic Pareto effect, i.e., that an increasing share of stock trading is driven by just a handful of large, popular stocks, which can be invested in via a growing multitude of structures, many of them ETFs.
The net effect of this shift is greater market concentration and more pronounced swings in sentiment. While IPO-focused ETFs can play a complementary role within a portfolio, they are unlikely to replace a well-diversified equity allocation. For most investors, broad diversification remains the most effective way to navigate periods of heightened market enthusiasm.
Want to invest directly in SpaceX?
Please remember that when investing, your capital is at risk. The value of your portfolio with Moneyfarm can go down as well as up and you may get back less than you invest. Past performance is not a reliable indicator of future performance. The views expressed here should not be taken as a recommendation, advice or forecast. Investing is usually for the long term, but it depends on the circumstances of each individual. If you are unsure investing is the right choice for you, please seek financial advice.
*As with all investing, financial instruments involve inherent risks, including loss of capital, market fluctuations and liquidity risk. Past performance is no guarantee of future results. It is important to consider your risk tolerance and investment objectives before proceeding.