


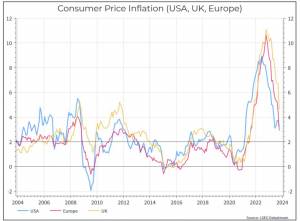
The latest inflation data from the US and the UK confirmed a trend towards slower price increases, and in both countries, the numbers came in slightly below the numbers that analysts had expected. The (very) familiar chart below shows year-on-year inflation for the US, the UK and the Eurozone. Inflation is normalising, but remains above the traditional 2% target that these Central Banks have typically used.
The better-than-expected inflation print prompted a rally across fixed income, as bond yields fell. Financial markets are now pricing in more rate cuts next year than they did a couple of weeks ago.
Let’s say that we can all accept that inflation is decelerating. What do we think matters most for financial markets? We think there are two issues.
How will policymakers react? This is easy to ask and tough to answer. We think Central Bankers will be slow to declare victory over inflation. But whether that means they cut rates by 50 bps or 100 bps next year is tough to answer and will doubtless depend on how the macro data develops between now and then.
What’s the ‘right’ level for policy rates? This takes a slightly longer-term perspective. We can agree that rates will probably come down next year, even if we can debate by how much. But it’s also not clear what the ‘long-term’ rate should be. One recent study by the New York Federal Reserve put the ‘neutral’ US policy rate at around 4%. The most recent projections from the Federal Reserve Open Market Committee (that votes on interest rates) put the range for the policy rate over the long-term at between 2.5% and 3.3%.
We think this matters for financial markets. Remember that, under normal circumstances, lenders should demand a higher rate to lend money for longer time periods (the term premium).
The chart below shows the spread between the yield on 10-year US government bonds and 3-month treasury bills. As you can see, that relationship is hardly stable – and it depends a lot on the economic environment. But the long-term average difference between the two is around 1.5%.
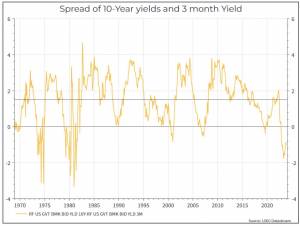
So, very crudely, if you just looked at averages and said you should have a 3% Fed funds rate and a 1.5% spread between that and the 10-year US Treasury, then you’d get to a 4.5% 10-year yield – more or less where we are today. Does that mean we shouldn’t expect the 10-year yield to fall very much from here?
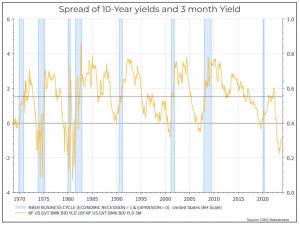
Inevitably, it’s not so simple. As we can see from the chart, the averages might not tell you very much. A lot depends on the economic backdrop.If we include US recessions in the chart, we can see that it’s often just before or during recessions that the 3-month yield is higher than the 10-year yield. If we did see a recession that might prompt the Fed to cut rates more aggressively and help bring down the yield on longer-dated securities.
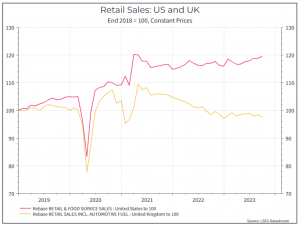
And that relationship is one reason why the current environment, particularly in the US, is so interesting. The bond market seems to suggest that the economy is in, or will soon be in, a recession. But other macro data suggests that the US economy is in pretty good health. The chart below shows retail sales for the US and the UK. UK retail sales are drifting lower from their post-COVID highs, while US retail sales continue to power ahead.
So, as we think about how attractive longer-dated bonds might be, we’re trying to think through what economic environment we’re going to be in. If we really do see a US economy that barely registers any impact from a sharp increase in policy rates, then maybe we won’t see 10-year yields fall much further from here. But if the slowdown is just around the corner, then those yields should be lower.
Where did inflation come from and why does it matter?
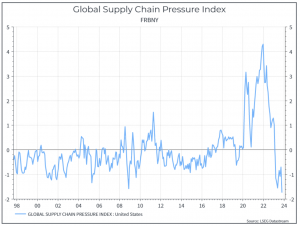
As annual inflation in the US and UK drifts lower, the question as to where it actually came from is ongoing. As is usually the case in economics, there are a few schools of thought. One says it was a supply shock – COVID meant a shortage of goods (like microchips for cars) and that pushed up prices. The chart below from the US Federal Reserve illustrates the point – it shows their measure of supply chain stress – which peaked in 2021 before coming down rapidly this year.
Another says it’s all about the money supply. Macro theory says if you have too much money chasing too few goods, then prices rise. And the response to COVID meant injecting a lot of money into the economy, which pushed inflation higher. That’s now being reversed and, predictably, inflation is coming down and should continue to do so.
The chart below illustrates the point. It shows broad money growth year-on-year in the US, UK and Eurozone. We can see the sharp increases during COVID and the gradual unwinding of that, which has meant broad money aggregates are currently shrinking. Monetary economists would argue that that should drive down inflation.
There’s a third point that’s worth making. It argues that we’ve been living in an unusual period of low inflation for the past 15-20 years, partly driven by China’s integration into the global economy and rapid emergence as a large exporter. There are some reasons to think that that period has come to an end – maybe due to ‘deglobalisation’ or to labour shortages that will push up wages.
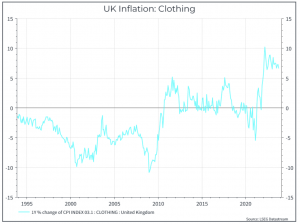
One chart tries to illustrate the point. It shows annual inflation for clothing in the UK. From the mid-1990s up until around 2010, we saw deflation in clothing – the consequence of cheap imports and the appeal of ‘fast fashion’ discounters. After 2010, we see inflation in clothing basically flat and, after COVID, it remains in positive territory. That has coincided, we’d argue, with rising wages and, in some cases, the movement of textiles manufacturers out of China in search of other lower cost producers. Deflation in clothing might be a thing of the past.
Why does all this matter? We think it’s relevant for thinking about what happens to inflation going forward. As we said before, we all agree inflation is slowing, but how far it slows is still up for debate. If you think the golden age of low inflation is over, then it might be that inflation stays higher for longer, at 3% rather than the 2% target. But if you think the inflation spike was predominantly a supply shock, then you could argue that Central Bankers have hiked rates unnecessarily – and that increases the likelihood of a recession and even lower inflation. Or if you somehow combine the two, you argue that short-term deflation is imminent, but the long-term inflation rate has moved higher, arguing for a higher policy rate in the future than we’ve seen in the past.
Where do we come out? So much for all that conjecture. Our current thinking is that inflation will come down, Central Banks will be cautious but will cut rates next year. We think that developed economies are likely to slow, with the US holding up better than Europe. Longer-term, we think that inflation will be a bit stickier than in the past and that staying at 2% could be a challenge. That could leave policy rates structurally higher than in the decade of the 2010s, with a similar result for long-dated government bond yields.
What does it mean for portfolios? The overall environment looks better than we might have feared earlier in the year. Inflation is coming down, albeit slowly, and demand has proven more resilient than expected – particularly in the US. That could argue for adding to risky assets. In our view, the two key risks remain a) that inflation will prove sticky, keeping rates higher and arguing against adding to long-duration bonds b) that anecdotal evidence of an economic slowdown begins to appear in the macro data and, by extension, in company results.
 Richard Flax: Richard is the Chief Investment Officer at Moneyfarm. He joined the company in 2016. He is responsible for all aspects of portfolio management and portfolio construction. Prior to joining Moneyfarm, Richard worked in London as an equity analyst and portfolio manager at PIMCO and Goldman Sachs Asset Management, and as a fixed income analyst at Fleming Asset Management. Richard began his career in finance in the mid-1990s in the global economics team at Morgan Stanley in New York. He has a BA from Cambridge University in History, an MA from Johns Hopkins University in International Relations and Economics, and an MBA from Columbia University Graduate School of Business. He is a CFA charterholder.
*As with all investing, financial instruments involve inherent risks, including loss of capital, market fluctuations and liquidity risk. Past performance is no guarantee of future results. It is important to consider your risk tolerance and investment objectives before proceeding.