What are we talking about? Financial markets remain quite volatile. We continue to think about what could prompt us to add to riskier assets like equities. We’ve discussed valuations quite recently, but wanted to dig into corporate profitability a bit more.
A bit more detail: In general, we think that valuations are a very useful indicator when we think about returns over the mid-long term, and they play an important role in our Strategic Asset Allocation process. But headline valuations may tell you less about returns over, say, the next twelve months.
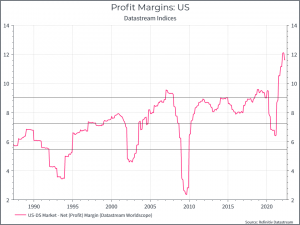
We often spend time looking at corporate profitability. As we’ve noted before, margins in Developed Market are high versus history. The chart below shows US margins, but the same applies to Europe and the UK. Corporate profitability has been well above long-term averages during the “post-pandemic” recovery.
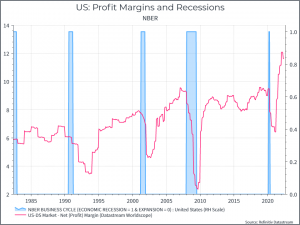
The second point to make is that, as you might expect, corporate profitability is cyclical – when growth weakens, profit margins usually fall. And the chart below overlays profit margins with recessions over the past 35 years.
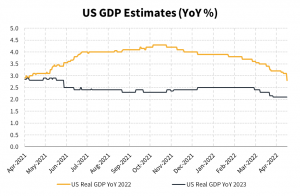
On the subject of economic growth, below are the consensus estimates for 2022 and 2023 GDP growth in the US. The chart shows a steady downgrade to growth estimates over the past few months, impacted by expectations of higher rates and the fall-out from the invasion of Ukraine.
The other point worth looking at is the relationship between margins and equity markets. The chart below shows the period 2007 to 2011, during the Financial Crisis. We see that corporate margins and US equities fell sharply during the crisis. US equities rallied well before we saw a recovery in corporate profitability.
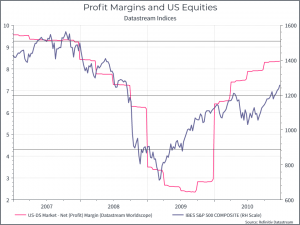
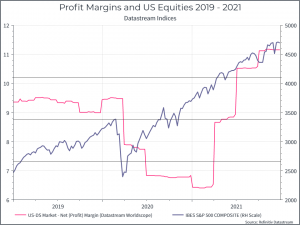
In a similar vein, we can look at the same chart for the period 2019 to 2021. Again, we see margins and equities fall quite sharply at the outset of COVID, and we see equities rally ahead of the profit recovery.
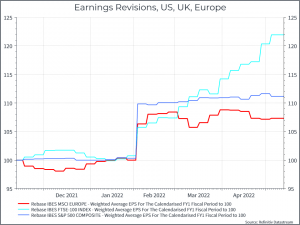
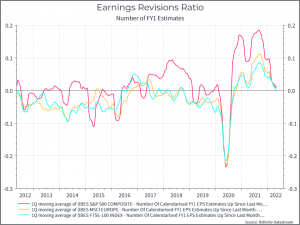
Finally, we should look at earnings revisions. The two charts below look at slightly different data. The first shows an index aggregate earnings – are they going up or down? The second shows the ratio of analysts raising (positive) or lowering (negative) their estimates, relative to the total number of changes. We see that earnings expectations for 2022 in the US and Europe haven’t moved very much, while the UK has seen upgrades – presumably helped by strong commodity prices. So far, the downgrades that economists have made to their GDP growth estimates haven’t yet translated into lower earnings expectations.
Where does this get us? There are a few points worth highlighting. First, given the downgrades to growth expectations, we’d guess that earnings forecasts are, in aggregate, too high. Second, recent history suggests that downgrades to corporate profitability could create an attractive entry point to add to equities – although you’d like to be able to extrapolate from more than two episodes! Third, as you might expect, equity markets will probably anticipate the recovery in corporate earnings – whenever it comes – well before we see it in the data. Finally, none of this is certain – and trying to wait for the absolute best time to add to risky assets is likely to be a futile exercise. So for now, we’ll focus on macro data and its impact on corporate earnings as a guide for when to add back to some of our equity exposure.


