What are we talking about? US inflation for October gets released tomorrow. We’d argue that improving US inflation data is one of the requirements for a better outlook for financial assets. So, it’s worth taking stock of where we are.
Where are we? US inflation has begun to slow, at least on a year-on-year basis. It was 8.2% in September and it’s expected to fall to 7.9% in tomorrows release. But it has decelerated at a slower pace than many had hoped, and that’s put pressure on financial markets and prompted more hawkish commentary from the Federal Reserve.
As we’ve said before, there are some decent reasons to think that US inflation should continue to slow and a few updated charts should illustrate the point.
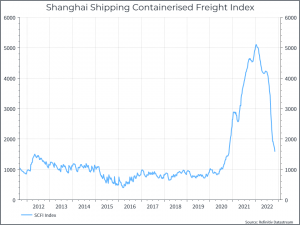
First, we see freight rates. The chart below shows container freight rates from China. We saw a sharp rise in 2020, given the disruptions to international trade. These freight rates are still above their pre-pandemic level, but they’ve come down a long way from where they were a year ago.
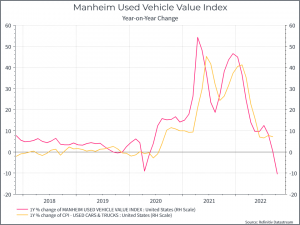
The next chart shows the change in the Manheim index of used car prices, and compares that to the used car prices in the CPI basket (albeit a fairly small component). Again, supply disruptions in the auto sector prompted a very sharp increase in used car prices in 2021. Here again, we’ve seen used car prices begin to fall over the past month or so, compared to the previous year. We’d expect to see something similar in the CPI release tomorrow.
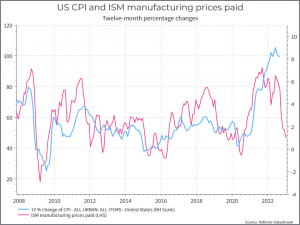
The next chart compares consumer inflation to the prices paid component of the ISM manufacturing survey. We can see that the prices paid component has come down sharply over the past couple of months. If the historical relationship holds (an important “if”), we should expect US inflation to continue to decelerate.
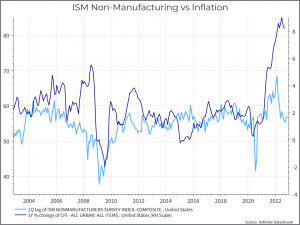
We can see a similar story looking at the services sector – with ISM services drifting lower, while US inflation hasn’t moved much.
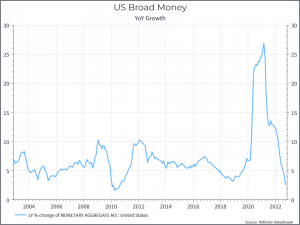
And, finally, from a monetary perspective, the chart below shows the growth in US broad money over time. After a dramatic acceleration during the pandemic, we’ve seen money growth fall sharply. In theory, that should also help to bring down inflation.
Where does this get us? There is a range of data to suggest that US inflation should continue to slow, and that’s what we expect to happen. But it has been stickier than many expected and that has meant that interest rate expectations have continued to move higher (as guided by the Fed). The October data point will be another important indicator of whether tighter monetary policy, slowing demand and some supply chain improvements are beginning to have an impact.
*As with all investing, financial instruments involve inherent risks, including loss of capital, market fluctuations and liquidity risk. Past performance is no guarantee of future results. It is important to consider your risk tolerance and investment objectives before proceeding.
