


Most equity investors have some exposure – likely more than they realise – to US equities and the US stock market. That’s because US equities have been exceptionally successful over the last decade, a reflection of deeper structural tailwinds. US equities are currently trading at elevated valuations, a factor that has drawn closer attention to their weight in portfolios. In this piece, written in collaboration with Moneyfarm, financial journalist David Stevenson explores how investors should approach US equities: all roads lead to intelligent diversification.
It’s not easy being a thoughtful, careful investor at the moment. You’re keen to invest in stocks and shares – aka equities – over the long term, but you keep hearing about the runaway success of US equities in particular. How can you best approach investing in US equities – and are there alternative ways to build exposure? These and other questions we’ll try and discuss in this article.
But before we get to what I sometimes call ‘survival’ tactics, lets address the (Republican) elephant in the room. The US – its economy and financial markets – matters greatly because of its exceptional success. The great story of the last decade has been one of US exceptionalism.
The US really is exceptional
Let’s start by understanding the sheer scale of the US footprint through a benchmark for global equity markets, the MSCI ACWI index. According to the firm that runs the index (MSCI), the MSCI ACWI captures large and mid cap representation across 23 Developed Markets (DM) and 24 Emerging Markets (EM) countries. With 2,528 constituents, the index covers approximately 85% of the global investable equity opportunity set. That ‘global’ set is worth $84 trillion with the US bit of it worth $54 trillion. Japan is second, but its slice is valued at just $4 trillion.
These are staggering numbers, but they don’t tell the whole story. Not all successful corporates are publicly listed, as many are private and owned by private equity fund managers. Even here, private asset markets are predominantly focused on the US. Most analysts believe private assets are valued between $15 and $25 trillion globally, depending on who you ask, with the US accounting for well over 50%.
Even in the more geographically diversified bond markets, the US remains a dominant force: bonds issued by US entities make up about 40% of a benchmark index called the Bloomberg Aggregate Bond index. In the world of bonds, US issues are liquid, diverse, and easily accessible, especially Treasury bonds issued by the US government, which are plentiful and becoming even more abundant (that big and beautiful budget deficit).
Then there’s the matter of the dollar. I’d guess that, apart from pound notes and euros from your summer holidays, the only other currency sitting at the bottom of your drawers at home is the dollar. The US has a currency, the dollar, that is recognized globally due to its lack of capital controls and a generally favorable tax system. However, for foreign investors, this system can become complicated, especially when it comes to dividends, as a withholding tax of up to 30% is often applied unless a tax treaty with their home country allows for a reduced rate.
The US is also a growing economy. According to a House of Commons Library briefing citing OECD data, the US had the highest GDP growth among G7 economies over the period from the fourth quarter of 2019 to the first of 2025 – at 12%. By comparison, the UK economy grew by just 4%. US GDP was around $21 trillion in 2019 and is now around $30 trillion in current dollar terms. The World Bank estimates the US share of the global economy at 26.2% in nominal terms – using market exchange rates – and 14.8% in purchasing power parity (PPP) terms, which adjust for differences in cost of living between countries.
So, let’s get one thing straight: the US is likely to dominate most of your investment portfolio, for very good reasons. The challenge is that of exceptionality. US equities are much more exceptional than ever before: local US equities are more expensive, more concentrated in a few stocks, and more sector-biased than in the past.
Even more exceptional challenges
Many long-term investment plans and global equity funds are benchmarked against the MSCI ACWI index (with the MSCI World or FTSE World as alternatives). This index has 64% exposure to US equities, with Information Technology as a sector accounting for 24%, and the Magnificent 7 (Alphabet, Amazon, Apple, Meta Platforms, Microsoft, Nvidia, and Tesla) making up just under 20% of the index. You might also see another benchmark, the MSCI World index, which has nearly 72% exposure to US equities and just under 22.5% to the Magnificent 7.
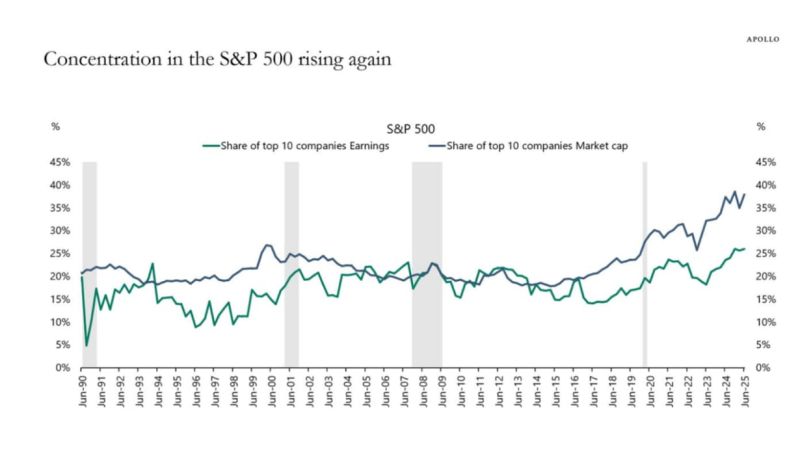
As for concentration risk, that’s only got worse in the last few months. According to Apollo’s Chief Economist Torsten Slok, the concentration in the S&P 500 has returned to extreme levels, with the top 10 companies accounting for 40% of the index’s market capitalisation and a record-high share of earnings. He cites the chart below, which shows a consistent upward trend in recent months. According to Slok, “the extreme index concentration in tech is obviously not good for investors seeking to diversify their investments across 500 different companies. Anyone investing in the S&P 500 index today is basically making a bet on the Magnificent 7 stocks propelling even higher.”
As for valuations, a process of determining an asset’s worth, well, they are ever so slightly high for US equities at the moment – something of an understatement! Since 1988, the average P/E ratio for the S&P 500 has been about 19.5, rising to around 23 over the past five years. Today, the index trades at a trailing P/E close to 25, expensive by almost any historical standard. If corporate earnings grow as expected in 2026, the forward multiple could fall to roughly 21 – less stretched than now but still above the long-term average.
US Equities, Price-to-Earnings ratios over recent years
| Date | P/E ratio |
| 31/03/2024 | 19.19 |
| 28/06/2024 | 19.75 |
| 30/09/2024 | 20.98 |
| 31/12/2024 | 21.78 |
| 31/03/2025 | 21.07 |
| 30/06/2025 | 24.31 |
| Current | 24.97 |
| Estimate for 2026 : current | 21.42 |
How to navigate around US exceptionalism
OK, so by now I think you’ve got the message. US equities are exceptional in many respects: exceptionally successful, exceptionally expensive, and exceptionally concentrated. What to do about it?
In my view all roads lead back to one word: diversification. By that I mean look through your various investments, in pensions, ISAs and dealing accounts, and understand how extensive is your exposure to the US. If, like most investors, your US equity exposure is relatively high, it’s worth noting that many other markets – including the UK, Japan and Europe – currently look cheaper by comparison.
Some more cautious or sceptical investors, concerned about the exceptionalism of US stocks, tend to keep their US equity share well below typical levels – often under 70% of their total equities, sometimes closer to 60% or even 50% for those who are particularly wary.
But a realist might say that that strategy above is a fools errand, chasing markets that deserve their lower rating. Why underweight the most successful, liquid, easily accessible market on planet Earth? If that’s the case, you might start from a different place. Yes, you want US equity exposure, but not quite in the same form as most investors. You might want more diversified exposure to a less concentrated bunch of stocks, or different sectors or even different investment strategies.
Funds first – why many investors start broad
A straightforward way to apply the idea of “sticking with the US but with a diversified twist” is to combine broad market exposure with a carefully chosen selection of individual stocks.
While many investors rely on funds for the core of their portfolio, some also build a smaller, more targeted allocation focused on specific companies or themes where they see long-term potential – for example, sectors such as technology or Artificial Intelligence (AI). Its obviously ‘the big thing’ exciting investors at the moment. One reasonable approach some investors take is to hold a small, focused “basket” of just a few stocks – for example, names such as Nvidia, Broadcom, Microsoft and Arista Networks, with perhaps AMD as an additional pick.
Active management and concentration risk
Another observation is that for those looking to diversify US exposure, most actively managed funds – whether unit trusts or investment trusts – tend to be less concentrated in the Magnificent Seven (especially Nvidia) and other big tech names. In other words, concentration risk is usually lower. This is partly because active managers aren’t typically paid to replicate an index heavily driven by just a few stocks – a role now largely taken over by ETFs.
Let’s take the example of the six actively managed US equity-based investment trusts listed on the London Stock Exchange. Over the years I’ve looked at all of them, and I can say with hand on heart all have a distinctive strategy or approach, although their fees are above 35 basis points per annum and stretch up over 100 basis points in one case. Two of the funds invest only in riskier, high-growth US small caps (not well captured by ETFs), two invest in income-focused stocks, and two offer a basket of large-cap names with more diversification. All have had their periods of outperformance over the benchmarks, but all have from time to time struggled to beat those benchmarks.
But even if you think that investing in an active US equities fund manager is a waste of time, then you could be more intelligent about a more passive, index tracking strategy (using ETFs for instance) – just keep it simple and track a US equity benchmark index like the S&P 500.
In the world of ETFs listed on the London market, there are currently around 319 ETFs that invest in US equities. ETFs that track the S&P 500 dominate the top ten list of ETFs by AuM – seven track the benchmark US index, two the NASDAQ 100, one the S&P 500 Tech sector ETF and one the MSCI USA index. The good news is that bar the NASDAQ trackers, hardly any of these massive (by AuM) funds charge more than 10 basis points (0.10%). As an aside, 84 ETFs track the S&P 500. The choice is overwhelming! But there’s much more choice than just tracking the S&P 500.
Beyond the S&P 500: equal weight and mid caps
You could, for instance, track another index called the S&P 500 Equal Weight index. This variation on the US index doesn’t weight all 500 stocks by their market cap (putting Nvidia in number one spot), but instead weights each of the 500 equally (0.2% of the index weight when rebalanced). This strategy has the effect of underweighting tech stocks and the Magnificent 7 and overweighting more mid-cap stocks. That could be a handy source of diversification for investors seeking US exposure without betting everything on the Magnificent 7 and, especially, Nvidia.
Sticking with that theme of weighting your US exposure to stocks with smaller market caps than Nvidia (the other 499 in the S&P 500), investors might also consider dedicated mid cap trackers – tracking the S&P Mid Cap 400 index – or even US small caps captured by the Russell 200 index. When it comes to US small-cap stocks, many investors favour active fund managers. Academic research suggests that passive strategies can be more challenging in this less liquid segment of the market, and that active stock selection can sometimes offer advantages.
Another 21 of those 319 US ETFs offer a strategy that skews the fund’s constituents towards US equities that pay a higher dividend. Remember my point about how expensive the US market is on most valuation metrics? There are very few ‘dirt cheap’, ‘value’ stocks on the US market, but another way into more reasonable (in valuation terms) stocks is to buy those that pay out a dividend – and also buy back lots of shares. These tend to be more conservatively managed, more cash-generative businesses, which are probably more mature. In other words, more defensive stocks which might come in handy if the tech giants suffer a correction.
Thinking long-term
US equities have long proved their resilience and continue to play a vital role in global portfolios. Yet today’s market looks different – more expensive and more concentrated – which makes it worth understanding the shape of your exposure.
Taking a thoughtful approach to how US equities sit within a portfolio can help investors stay aligned with their long-term objectives while benefiting from the structural strengths of the American market.
Invest in US shares with Moneyfarm
Ready to tap the US market? US equities can offer exposure to some of the world’s most innovative companies, while also coming with risks such as higher valuations, potential volatility and sensitivity to economic or political events.
With Moneyfarm DIY Investing you can do it via your Stocks & Shares ISA or GIA – simple pricing, integrated analytics, hassle-free tax admin (we handle the W-8BEN; inside an ISA your returns are tax-free), transparent GBP↔USD conversion, and everything in one place (shares, ETFs and managed funds). Or go curated with our Special Collections – Tech Titans, The AI Revolution, California Dreaming, Electric Mobility, and Latest IPOs – designed and monitored by our Asset Allocation team to help you explore opportunities with confidence. But remember that themed investments are more concentrated and may carry higher risk than a diversified portfolio.
This article was written by an independent financial journalist, in collaboration with Moneyfarm. It is for information purposes only and reflects the author’s personal views. It is not investment advice or a recommendation. Investments can fall as well as rise in value and you could get back less than you invest. Past performance is not a guide to future returns. Overseas investments may be affected by currency movements. Tax treatment depends on individual circumstances and may change. References to any company, index, ETF or fund are for illustration only. If you are unsure about an investment’s suitability you should seek advice from an authorised financial adviser.
*As with all investing, financial instruments involve inherent risks, including loss of capital, market fluctuations and liquidity risk. Past performance is no guarantee of future results. It is important to consider your risk tolerance and investment objectives before proceeding.