What are we talking about? European equities have come under pressure recently, amid concerns about the impact of the war in Ukraine. We take a look at valuations, earnings and the risks to growth
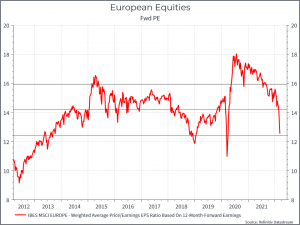
Starting Valuations: The chart below shows the forward Price/Earnings ratio for European equities over the past decade. We can see that the drop in European equities puts valuations close to one standard deviation below the long-term average.
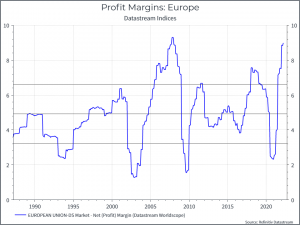
One key question is whether forward earnings, the denominator, is overstated. The chart below shows profit margins in Europe. We would argue three things. First, overall profitability has drifted higher over time. Second, and most importantly, margins are high relative to history. And third, that there is some cyclicality to profitability (ie stronger economic growth usually means companies make more money!).
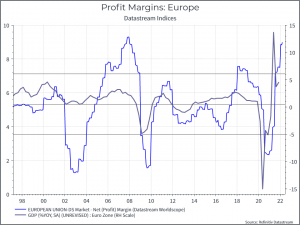
The chart below illustrates the final point. It compares corporate profit margins in Europe with GDP growth. As you might guess, there’s some link between the two.
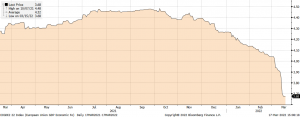
So, lets turn to GDP growth expectations. The chart below shows consensus expectations for 2022 GDP growth in Europe. We’ve seen downgrades to estimates accelerate over the past couple of weeks, as analysts have begun to factor in higher energy costs and a hit to confidence that’s likely to come out of the current crisis in Ukraine.
The other consideration is the ECB. Inflation is well above target and the ECB, along with the Fed and the Bank of England, has a difficult path to tread if it’s going to rein in inflation without causing a significant slowdown in growth.
Where does this leave us? European equity valuations look cheap versus history. They’re probably not quite that cheap after we factor in likely earnings downgrades that you might expect to see, but we can say that some of the potential bad news is already priced in.
