By Richard Flax, CIO at Moneyfarm. The view of our CIO will be a recurring series, focusing on developments in financial markets and their impact on investors.
When it comes to the global economy – particularly the intangible and abstract jargon of the financial markets – it is often difficult to mentally connect the data with the real world. In this article, we’ll discuss some of the inefficiencies that have been created in the global economy and, chiefly, what they can tell us about inflation.
Whether you’re a consumer, an investor, or both, you’ve probably spent a good amount of time recently thinking about the price of goods and services. Recent inflation reports, notably in the US, have come in above market expectations – reflecting what many consumers are feeling in their wallets – prices have gone up. The chart below shows annual US inflation going back ten years.
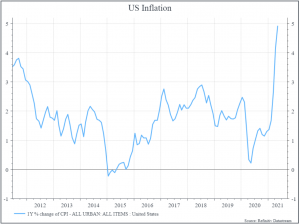
There’s a lot of debate around inflation – why has it risen? Will it remain high? What signals should we look at?
There are various ways to think about rising prices. One way is to think simply in terms of supply and demand. During the pandemic, we saw lots of supply shocks – businesses closing or spending less, people needing to self-isolate. And we saw demand shocks too – both positive and negative – not much demand for airline seats in 2020, much more demand for hand-sanitizer. The chart below shows an index of US retail sales – showing how quickly US retail spending recovered, and then increased, after the early days of the pandemic.
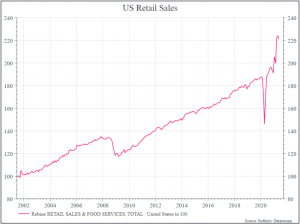
And those contrasts – between less supply of goods and services and shifts in demand – are part of what’s behind the rise in prices. While people still aren’t moving around that much, the opposite is true for goods. All those “good-ideas-at-the-time” – the exercise bikes and running shoes – have put some pressure on global supply chains, particularly as overall demand has increased.
The chart below illustrates the point. It shows the cost of shipping a container across a range of typical sea routes. In most cases, we’ve seen a sharp increase over the past six months – and you’ve probably noticed the impact.
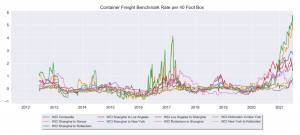
So that’s where we are. The interesting question is – what happens next? Under normal circumstances, you’d guess that higher prices would attract more investment. And that logic seems to be holding. According to IHS Markit, orders for new container ships are currently at a five-year high, reflecting a period of limited new orders even before the pandemic hit. But building new container ships takes time. It might only be in 2024 that we see this new capacity really kick in.
As we think about inflation, the story with shipping containers repeats itself. Where are there bottlenecks currently, mismatches between supply and demand? And how quickly will they be resolved?
We’d expect that some of the bottlenecks reduce as the global economy continues to re-open. There are only so many exercise bikes you can buy, after all. But it looks like it’ll take some time before we get a lot more capacity.
There’s a similar story in commodities. The price of copper, for instance, has risen sharply (see chart below) – partly perhaps on expectations that it’ll be a key beneficiary of the increased electrification – thanks to rising demand for electric cars.
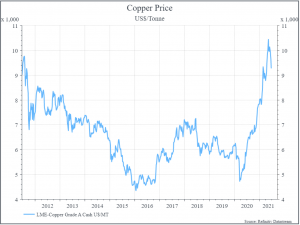
But constructing a new copper mine typically takes a lot longer than building a container vessel – never mind the irony of increased mining investment to address environmental concerns – so a supply response there may take longer.
There’s one more example to share – the labour market. Again, the US experience highlights the point quite well.
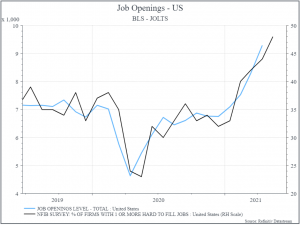
The first chart shows the number of job openings and the proportion of employers who are finding it hard to hire workers. It shows a positive environment for workers – lots of job openings and employers saying they can’t find staff. Small business owners are also noting that large employers (like Walmart and Amazon) are raising their hourly wages to find more staff.
In the UK, we hear echoes in the restaurant sector where employers are struggling to find serving staff.
The second chart shows the US unemployment rate. It rose sharply last year during lockdown, and has fallen since, but it remains well above the levels we saw pre-pandemic.
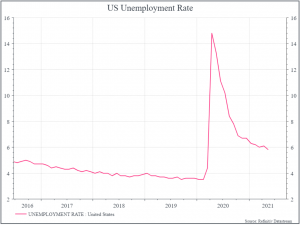
Something’s not quite right here. The unemployment rate is still high, but employers are having to increase salaries to find workers. One possibility is that people in regions where there’s still pandemic income support have decided to wait until it ends before looking for work. If that theory is right, we could see more people looking for work after the summer.
So when we think about inflation, and supply and demand, we’ve got a few different categories. There could be the labour market scenario – where we think we’ll see more people looking for work after the summer. The container story, where we’d expect some short-term benefits from normalisation, but where we might have to wait a year or two before we see new capacity arriving. And finally the copper mining example, where, if demand stays strong, it might take time for new supply to arrive.
There are lots of other variables to consider when we think about inflation but these short examples suggest that some of the inflation we’ve seen probably will be transitory, but, like so much else, it might take some time before we get back to where we were pre-pandemic.
