For the past couple of months, just about every area of society has been profoundly impacted by the spread of COVID-19. As governments the world over take measures to grapple with the virus, global markets have seen near-unprecedented volatility as lockdown laws and travel restrictions all but freeze economies.
This is, of course, a global health crisis more than it is a financial problem, but there is no getting away from the fact that significant market swings affect lives. Monday 16 March represented one of the worst days seen in the history of the stock markets, while the knock-on effects of the global shutdown will likely be felt for some time.
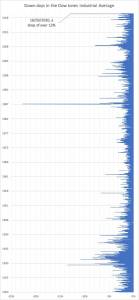
This started us thinking about how the one-day drop on March 16 compared to similar movements historically, and what markets tended to do after them. Below is a graph detailing the negative days seen in the Dow Jones over the past 100 years.

It does make for pretty grim reading. Only during the Great Depression and in 1987 were more significant daily drops recorded than we saw last month. Ordinarily, volatility rises until it hits a crescendo. In this instance, we reached that crescendo more quickly than ever before.
Such is the nature of the coronavirus crisis that the impact was felt almost immediately, and the duration of that impact is almost entirely dependent on the success of containment strategies and vaccine development. It’s important though, to remember that risky assets will occasionally be subject to large fluctuations and to think about these movements, along with the current volatility, within the context of wider long-term growth trends.
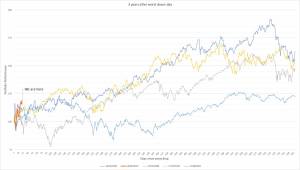
To do this, we looked at what happened after historic market down days. We took the four worst down days in the last 50 years, mapping subsequent growth to get a picture of how markets respond and rally over a three year period.

Dips like the current one we are facing are rare, but not all are caused by financial crises. Markets took a significant hit in 2001 after the 9/11 attack, for example, a short-lived dip which markets bounced back from in the immediate aftermath. The three other examples we have taken as an example are prolonged, considerable dips, from which we can draw a picture of how even the worst-case scenario presented by COVID-19 might play out.
In all cases, a period of three years was enough to see positive growth, even after the worst one-day performances in history. After the dips in 1987, 1997 and 2008, growth over the subsequent three years was significant. At our current position, it is too early to say with any confidence that we’ve passed through the lowest point – take the trajectory in 2008, for example. Investing in these down moments can reap rewards though, even if deeper drops are to come before prolonged growth can be achieved.
If these expectations are anything to go by, the projection only reinforces our commitment to long-term investing. Markets have, historically, always recovered. As much as past performance is no indicator of future returns, we can be confident that markets will recover in the medium term and that this recovery will reward investors that stay the course or invest in or around the nadir.
Now is a good time to invest and, as we have told our investors, selling while markets are low is a surefire way to cement any losses you might have incurred during the downturn. It is best, we believe, to ride the dip and capitalise on the periods of often sharp recovery that tend to follow difficult economic situations.


