With the new tax year getting underway as many people find themselves in varying states of lockdown, now is an ideal time to tackle some often overlooked pieces of financial admin. For those with existing investments or those looking to invest, assessing your choice of wealth manager can be one of these.
We recently published a blog post outlining the things to consider when assessing your investments. Along with fundamentals like cost and asset allocation, one of those key considerations is how well your portfolio is performing.
How do you know if your investments are really performing? Could your money be better placed elsewhere? We explain the basics below.
The importance of peer comparison and what makes a good comparator
For wealth managers and investors, peer comparison is an important tool in performance analysis. The ability to compare returns with other providers helps to put those returns in perspective.
For example, consider an annual return of 2%. If you asked an investor if they would be happy with these kinds of figures they might say no. Put that 2% return within the context of a wider market downturn of -10% however, and the performance becomes a lot more impressive. In many ways, performance means very little without a clear comparison to measure it against.
Of equal importance however, is ensuring the right comparator is chosen. Unfortunately, all too often we see managers comparing their performance to a self-selected collection of indices or an irrelevant investment, which is why independently verifying performance is key.
For a comprehensive overview of the competition, we use ARC’s independent Private Client Indices as our comparator. ARC’s tool brings together data from a sizeable peer group to give an understanding of what the actual performance looks like across a number of providers.
ARC creates its indexes using the returns of the likes of Barclays Wealth, HSBC, Investec Wealth and Blackrock, as well as many others. The Indices are created using an average of real performance figures provided by these participating investment managers – no synthetic or model data is used. For full information on the portfolios used for comparison and the ARC indexes we focus on, head to the portfolios page of our website.
We use ARC because it gives a broader view of the performance of the UK’s wealth management firms – it gives our investors an idea of how, on average, their wealth could be performing if managed elsewhere.
How our performance compares
For an overview of how we compare with the ARC indexes, the below shows the performance of Moneyfarm’s seven risk profiles from 2016 until the end of Q1 2020, including the significant recent market falls.
Returns in this instance are for a theoretical £250,000 portfolio, with the relevant management costs applied, and past performance is no guide to future performance.
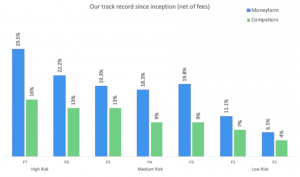
To give a better insight into how our individual portfolios have performed against this index over time, including the recent market crash, below are the performance charts for our P2, P4 and P6 risk levels – low risk, medium risk and relatively high risk respectively.
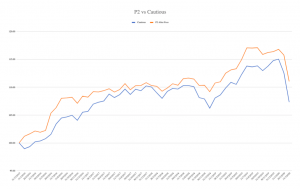
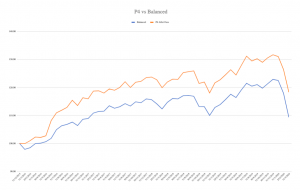
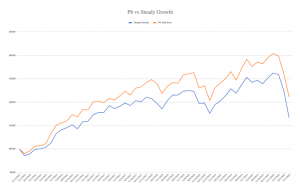
You can find more information on how this comparison is compiled, along with the data for our other risk profiles, on our website.
How we achieve this
At Moneyfarm, we achieve this performance thanks to a handful of key operational elements.
Firstly, we ensure our investment portfolios are robust through diversification. Asset allocation is a vital part of investing and upsetting the balance can lead to portfolios that are everything from overly cautious to extremely volatile. Different goals and different time frames require different allocations – getting this right is one of the core fundamentals of an investor’s strategy. At Moneyfarm, our team of asset allocation experts actively manage our portfolios to ensure your money is placed as effectively as it can be.
Secondly, we do everything we can to keep costs both as low as possible and fully transparent. If fees are too high, they can seriously eat into your returns. We typically invest in high-quality exchange-traded funds, or ETFs, which keep costs low while also achieving effective diversification. We minimise trading costs by focusing on long-term trends rather than regular trading, a decision that sees our investors keep more of their returns in the long run. When we do trade, we foot the bill for any costs on behalf of our customers, meaning you don’t have to worry about additional fees.
We also actively manage our portfolios on a regular basis, ensuring that each risk level is made up of assets that we believe will perform well. Some wealth managers will assign a portfolio to a new investor but fail to maintain its composition – just a few underperforming assets can seriously affect the overall returns on investment across the long-term.
How you can assess performance
When assessing the performance of your investments it is crucial to make sure that the comparison is relevant. For example, comparing a low risk portfolio to a high risk portfolio won’t give you any valuable insight.
You will often find that a lot of funds will choose a benchmark, usually an index, which they will then quote their performance against. For example, a fund that invests purely in UK stocks will probably assess their performance against the performance of FTSE 100 or the FTSE all-share. They will then often have to quote their relative performance in their Factsheets (a report released by the fund). This sort of benchmarking or peer comparison can give a greater insight into the performance of a particular investment manager.
Alternatively, we can do the legwork for you.
If you are interested in having your investments outside of Moneyfarm comprehensively assessed by our team, please feel free to get in touch. As a free, impartial service, we will examine the allocation, performance and costs of your investments to create a report that puts it all in perspective. If you then want to talk about how you could improve your financial assets, we’re on hand to run you through it.


