


As we’re nearly at the end of the year and Santa is fast approaching, our special contributor and Daily Telegraph investment columnist David Stevenson takes a slightly left-field look at investing, markets and money.
What follows is a somewhat random list of curious facts you can drop into your festive holiday dinner conversations. No great expertise in markets and stocks is required, but they might just impress your relatives, or at least give them something interesting to think about.
1. The Santa rally: more than a market legend
Stock markets are superstitious. Yes, these remarkable engines of rationality, vast global evaluators of future value (and loss), are profoundly influenced by Christmas legends. Case in point, the Santa rally. This is precisely what it sounds like: markets tend to rally before Christmas in December. First identified by Yale Hirsch in his 1972 book the Stock Trader’s Almanac, the trend is that markets usually rise ahead of the December holiday period.
Let’s step back here. You might reasonably ask at this point: why on earth does the imminent appearance of Santa from Lapland with his reindeer matter to hard-nosed investors? Academics and analysts have long struggled to find a conclusive explanation for this, but some suggest one explanation might be tax-loss selling, where investors realise capital losses this month to offset gains for the upcoming tax year.
There’s also what’s called window dressing, where institutional fund managers tidy up their portfolios before the year ends. I’ve also heard slightly more outlandish explanations about investors spending more time at home facing screens or the impact of all those Xmas salary bonuses.
I’m not entirely convinced by any or all of these, but there is some evidence that the Santa rally is real. One wealth manager looked at a 50-year time horizon and found that the US S&P 500 rallied in 36 of the past 50 Santa rally periods, averaging 14.4% annualised returns. Another investing platform also found that the Santa Rally is strongest in the UK.
At the same time, the US sees the weakest seasonal effect while the UK via the FTSE tends to shine with the month delivering a 92% of annual price gains, albeit with dividends not included.
The analysis shows that over the past 25 years the US benchmark index, the S&P 500, has delivered an average return of 0.94% in December – a figure comfortably outpaced by the FTSE 100’s 1.84% gain. It also highlights how December has accounted for around 14.8% of the S&P 500’s total annual performance, compared with a striking 91.5% for the FTSE 100.
Bring on the Santa rally.
2. All that glitters really is gold
The compelling investment story of recent years – the narrative everyone is eagerly discussing – must surely be the rise of Artificial Intelligence (AI), right? Perhaps, and if we judge by column inches and the use of Calibri text online (which the Trump administration disliked and is now banned), AI definitely dominates headlines. But if you examine the hard financial data, another story, or rather a different narrative, shines brightly.
Strategists at Deutsche Bank recently compiled an impressive document full of investment facts that make you go wow (they really did call it that), and chose to highlight the chart below.
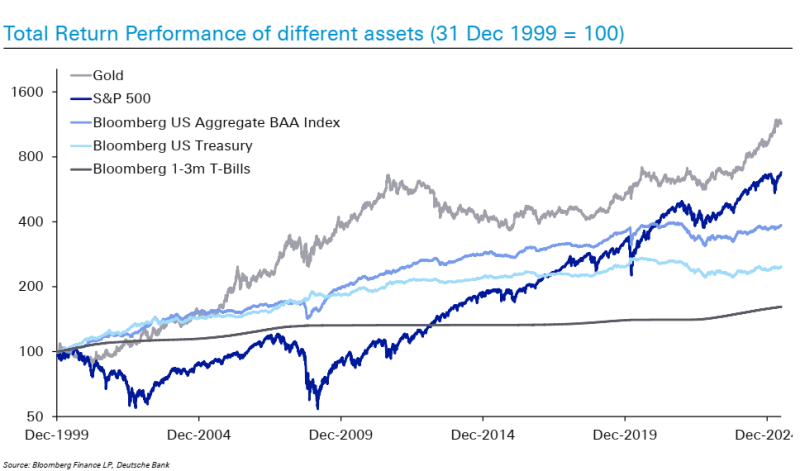
They argued that, despite the prominence of AI and the exceptional returns delivered by technology stocks, gold has been the standout performer of the 21st century so far. Since the end of 1999, its value has increased more than elevenfold, compared with a 6.8-times rise in the S&P 500.
Silver has been even more striking in certain periods: while Nvidia’s shares are up around 37% year to date, gold prices have gained roughly 61% and silver has surged an extraordinary 117%. Over the past decade, silver’s price has climbed by around 350%.
That said, past performance is not a reliable indicator of future results, and historical outperformance does not guarantee similar returns going forward.
3. Bitcoin’s many comebacks
Time now to impress the younger crypto bores at Christmas time.
Everyone and their aunt – maybe even their grandma – knows that Bitcoin is volatile. Opinions tend to be firmly split: people either believe in it passionately or dislike it intensely. What is less widely appreciated is that, looking at the historical data, Bitcoin has so far tended to recover after its troughs – although the timing and scale of those recoveries have varied significantly.
As I write, Bitcoin is trading around $87,947, well below its peak of nearly $125,000. Even so, historical data suggests that recoveries have often followed previous downturns, though this should not be taken as a prediction of what will happen next.
Over the past 15 years, Bitcoin has gone through more than 40 full boom-and-bust cycles. Across these episodes, the average peak-to-trough decline has been about 35.7%, with a median drop of 30.4%.
A typical Bitcoin drawdown sees prices fall by around one third from peak levels. The current decline, from a high above $124,000 to about $87,700, is broadly in line with this pattern, equating to a 30% drop. Historically, these declines have lasted around 50 days on average (about 1.7 months), with most corrections playing out within one to two months. The current down cycle is now just over two months old.
Some downturns have, of course, been far more severe – most notably the -93% crash in 2011. Other major corrections include the 2013–2014 bear market (-70%), the 2017–2018 sell-off (-65%) and the 2022 bear market (-60%).
There is also a more constructive side to Bitcoin’s history. Around 50 trough-to-peak recovery cycles show average gains of 206%, although the median increase is a more modest 47%, reflecting the influence of a small number of outsized rallies. These recovery phases have tended to last slightly longer than drawdowns, averaging just over two months. Exceptional examples include the 2011 surge (+4,253% in 65 days), the 2012–2013 bull market (+2,161%) and the 2020–2021 rally (+302%).
The bottom line? So far, Bitcoin’s drawdowns have often been sharp and relatively short-lived, with an average decline of around one third over roughly 50 days. When recoveries have occurred, they have tended to last a little longer – about 67 days on average – and have delivered substantially larger gains from trough to peak.
As always, past performance is not a reliable indicator of future results, and historical recoveries do not guarantee similar outcomes going forward.
4. Women make better investors
Most of us have probably heard of Men Are from Mars, Women Are from Venus, the bestselling book by John Gray – even if far fewer of us have actually taken the time to read it. But it does nicely sum up the view that women and men do have different cognitive and behavioural biases, even if we are talking about a dispersion of outcomes that obscures the range at the individual level.
Nevertheless, when it comes to finance, money and investing, I am willing to make a wager: most professional investors and especially traders (I’m thinking hedge funds here) are men. I say this with no great enthusiasm, because I have long held the suspicion that all this testosterone is possibly not a good idea when it comes to long-term investing.
Multiple studies indicate that, on average, women achieve slightly better investment returns than their male counterparts. This performance difference is often attributed to behavioural traits, with women exhibiting a more disciplined and long-term approach to investing.
Another way of putting it is that there is mounting evidence that women make better investors, on average. Take a study from Warwick Business School, which analysed 2,800 investors over three years. This found that female investors’ returns outperformed the FTSE 100 by 1.94%, while men’s returns were only 0.14% above the index. This resulted in women outperforming men by 1.8 percentage points.
Similarly, a 2021 Fidelity analysis found that women’s portfolios outperformed men’s by 40 basis points, or 0.4%. This trend has been observed over multiple years, with data from the investing platform Openfolio showing that female investors outperformed men in 2014, 2015, and 2016.
Having not read Men Are from Mars, Women Are from Venus, I can still make an educated guess as to why more women are successful investors. The main reason is that women tend to be more risk-aware, leading to more cautious investment behaviour, which is advantageous given that equities are inherently quite volatile. For example, one study found that women were 50% less likely than men to experience a 30% or greater loss.
Another possible factor is… you guessed it… overconfidence. A study from the 1990s found that men traded 45% more than women, reducing their net returns by 2.65% annually, compared to a 1.72% reduction for women. Less frequent trading, a trait often seen in female investors, helps reduce transaction costs and the chance of making impulsive investment decisions.
5. My home is my castle (pension plan)
One common complaint among fund managers about investing in the UK and Europe is that local investors are far too focused on property rather than on their local stock markets. By contrast, the US possesses a deeply ingrained ‘equity culture’ where people from all walks of life engage with the market. This broad-based participation helps explain why the US stock market is so resilient and why US businesses have unrivaled access to risk equity capital.
The reality of relative returns across national markets is a little more nuanced than this – European markets have, in fact, outperformed US markets so far in 2025. That said, let’s focus on the “home” part of the argument. Has investing in your home, in the form of residential property, been a successful investment? It will probably come as no surprise that the answer is a resounding yes.
Over the last 40 years (roughly 1985–2025), UK house price inflation has been an outlier among G7 nations, exhibiting exceptionally high real growth that is matched only by Canada. While nominal prices have risen everywhere, real house prices (adjusted for inflation) in the UK have nearly quadrupled, significantly outpacing the US, France, and Germany. In contrast, Japan, Italy, and Germany have seen periods of decades-long stagnation or real-term decline.
| Tier | Description | Countries | Approx. Real Growth (40 Years) |
|---|---|---|---|
| Tier 1 | Very high growth | 🇬🇧 UK, 🇨🇦 Canada | +300% to +400% |
| Tier 2 | High growth | 🇺🇸 USA, 🇫🇷 France | +100% to +150% |
| Tier 3 | Stagnation / Decline | 🇩🇪 Germany, 🇮🇹 Italy, 🇯🇵 Japan | -20% to +40% |
The UK (alongside Canada) stands out within the G7. Since the early 1980s, UK house prices have risen around 3.5 to 4 times in real terms, far outpacing wage growth and becoming increasingly detached from earnings.
How does this compare with equities? A Willis Owen analysis comparing UK property with the FTSE All-Share shows that over the 30 years to late 2023, average house prices rose about 427% in nominal terms. Over the same period, the FTSE All-Share rose around 160% on a price-only basis, but about 631% once dividends are included – the more relevant measure for long-term investors.
By contrast, US house price growth has been much more modest, while US equities have delivered materially stronger long-term returns than UK residential property. Since the pandemic, higher interest rates have cooled housing markets across the G7, but the UK’s chronic supply shortage has helped support prices. As of 2025, the UK remains one of the most expensive property markets in the G7 relative to fundamentals.
6. The world’s most successful investor you’ve never heard of
Many of us have too much time on our hands during Christmas and can, especially after Boxing Day, get a bit…well…mopey or dismal. We contemplate our depleted bank account and wish we had been more successful with our investments. If only we could be more like those great, successful investors we’ve all heard about, like the sage of Omaha, Warren Buffett.
Here’s my challenge: why focus on famous investors? Everyone knows what these guys (and they are, sadly, nearly always guys) do. Why not focus on the investors you’ve never heard of? Here’s my favourite curated list of insanely successful and largely anonymous investors!
Herbert Wertheim, often dubbed the “optometrist billionaire”, is an ultra-long-term buy-and-hold investor with an estimated net worth of around $5.3bn. Trained as an optometrist and inventor, he built his fortune not through hedge funds or flashy trading strategies, but by steadily investing his personal earnings in the stock market over several decades.
Wertheim’s scientific background strongly shapes his investment approach. He focuses on companies with strong intellectual property and deep patent portfolios, famously spending time reading technical manuals and patents rather than relying solely on financial statements.
His most notable investment is Heico, an aerospace parts manufacturer. Wertheim spotted the company’s powerful regulatory “moat” early on – particularly the barriers created by FAA approvals for replacement parts. He now owns roughly 7.5% of the company, a stake worth over $1bn on its own.
Over the long run, Wertheim has compounded his wealth at an estimated 20% per year. His portfolio also includes long-held positions in companies such as Microsoft and Apple, which he has owned through multiple market cycles.
Karthik Sarma, founder of SRS Investment Management, runs an activist, quality-focused strategy and oversees around $7.5bn in assets. Since 2007, the fund has delivered roughly 12.9% annualised returns, with standout years such as +36% in 2021.
A former Tiger Global analyst, Sarma is one of the so-called “Tiger Cubs”, yet he operates largely under the radar despite earning paydays that rival – and in some cases exceed – those of far more famous managers. In one recent year alone, he reportedly earned around $2bn, largely driven by a single high-conviction investment.
Sarma is best known for his long-running bet on Avis Budget Group, which he held for more than a decade. He actively pushed for share buybacks that cut the company’s share count by about 20%, positioning the stock for a dramatic squeeze during the post-COVID travel boom – a move that generated billions for SRS.
His portfolio remains highly concentrated, with Netflix accounting for nearly a quarter of assets, alongside sizeable positions in Meta and Avis. Sarma is also notable for his exceptionally long holding periods, often exceeding 10 years – a rarity in the hedge fund world.
Chris Brown, founder of Aristides Capital, runs a small-cap and special situations strategy and currently manages over $200m in assets. Since launching the fund in 2008, he has delivered around 15% annualised returns with no losing years – a rare track record.
Brown specialises in shorting questionable small-cap stocks – companies with shaky business models or dubious financial claims that often attract retail enthusiasm but lack fundamental value. These short positions are balanced with undervalued, overlooked long investments and niche arbitrage opportunities, such as SPACs or preferred shares.
He deliberately keeps the fund below $300m in size, recognising that his strategy – particularly shorting illiquid small caps – does not scale well with larger pools of capital.
Cliff Sosin, founder of CAS Investment Partners, is a deep-value investor running an exceptionally concentrated portfolio, with assets under management of more than $1.5bn. He typically holds just five to eight stocks, a level of concentration that creates significant volatility but has delivered strong long-term results for investors willing to tolerate it.
Sosin is best known for his investment in Carvana, which he held through drawdowns of around 90% before benefiting from the subsequent recovery. As of Q3 2025, he has been building a position in Latham Group (SWIM), backing a turnaround in the pool and broader consumer discretionary market despite recent earnings disappointments.
7. The wonders of compounding
I’ll finish with a simple but essential point: the remarkable power of compounding, especially when combined with disciplined saving and investing – and plenty of time.
For someone in their 20s or 30s, retirement can feel like a very distant prospect, something that belongs to a future version of yourself. Because it seems so far away, it’s often pushed to the bottom of the to-do list. Ironically, that’s exactly when compounding works best.
Saving even modest amounts into a SIPP (Self-Invested Personal Pension) can pay off handsomely over the long term. Each contribution has decades to grow, and crucially, to earn returns on top of returns. Time, more than anything else, is doing the heavy lifting.
A SIPP also gives compounding an extra boost through tax relief. For every £80 you contribute, the government adds £20, meaning your money starts its journey at £100 before it has even been invested. Over long periods, that upfront uplift, combined with tax-free growth within the pension, can make a surprisingly large difference to the final pot.
The maths is fairly unforgiving. Start early, and compounding does much of the work for you. Start later, and you can still build meaningful savings – but you’ll need to contribute more, or accept a smaller outcome. There’s no magic here, just the quiet, persistent power of time working in your favour.
Discover our Share Investing
Want to discover more about Moneyfarm Share Investing? Visit our dedicated Share Investing page to explore our comprehensive range of stocks, ETFs, bonds, mutual funds, and Curated Collections. With Moneyfarm Share Investing, you can take charge of your investments across a variety of asset classes, offering you greater control over your financial future.
As with all investing, your capital is at risk. Forecasts are never a perfect predictor of future performance, and are intended as an aid to decision-making, not as a guarantee. This publication does not contain and should not be taken as containing, investment advice, personal recommendation, or an offer of or solicitation to buy or sell any financial instruments. Prospective investors should seek independent financial, tax, legal and other advice before making an investment decision.
*As with all investing, financial instruments involve inherent risks, including loss of capital, market fluctuations and liquidity risk. Past performance is no guarantee of future results. It is important to consider your risk tolerance and investment objectives before proceeding.