


UK government bonds have been in focus recently. Bond yields have drifted higher on concerns about budget deficits ahead of the upcoming budget – now scheduled for November 26. We wanted to dig into this a bit more and put the recent moves in context.
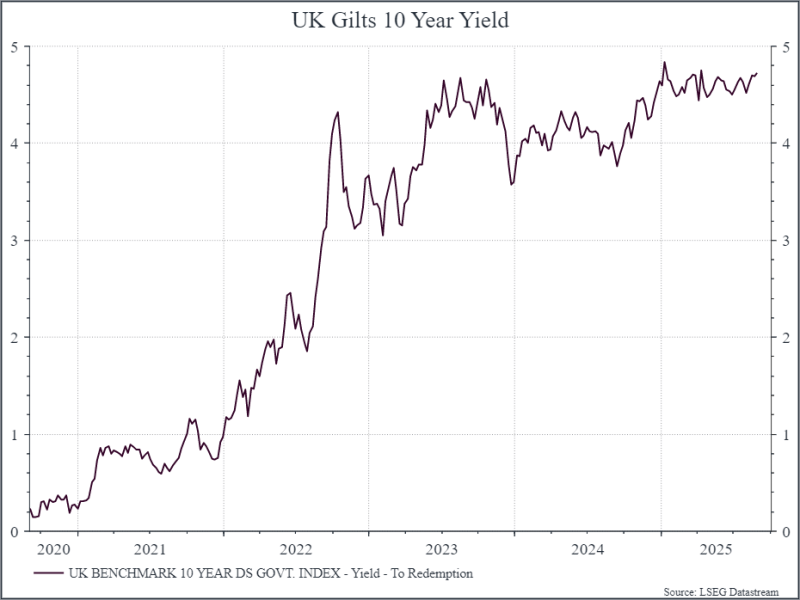
The chart below shows the yield on the UK 10-year government bond over the past five years. We’ve seen a sharp rise from the lows of Covid. We can see the impact of the Liz Truss mini-budget in 2022, when bond yields spiked. And we can see the steady drift higher in yields over the past couple of years. The 10 year and the 30 yields touched their highest level since before the Great Financial Crisis.
What’s behind this? There are a few things to consider.
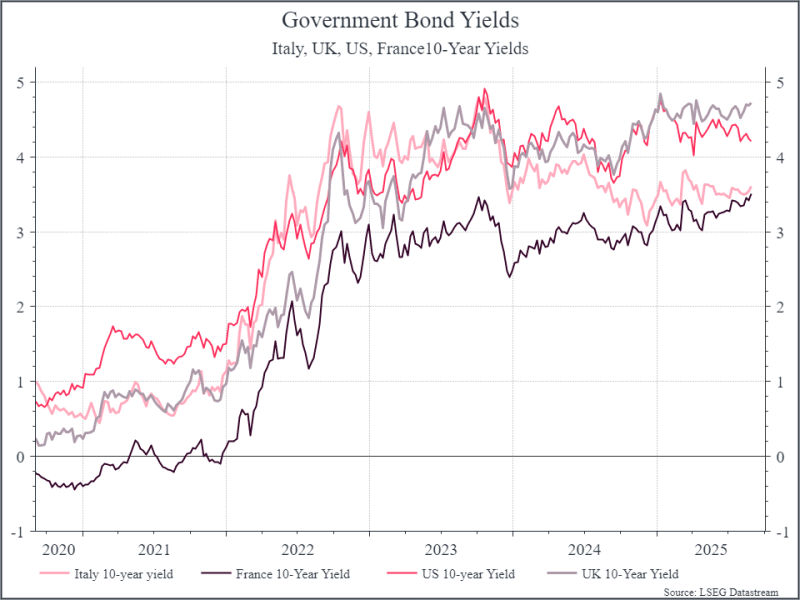
First, the UK isn’t alone in seeing a move higher in bond yields. The chart below shows 10-year government bond yields for a number of developed economies – Italy, France, the US and the UK. UK yields are currently the highest, but all four countries have seen a similar trend from the very low levels during Covid.
What affects the yield on government bonds? There are a couple of things to keep in mind. First, investors consider how good a credit the country is – essentially, what its debt metrics look like. Second, investors think about the risk from inflation and the impact on monetary policy. These bond yields aren’t inflation-adjusted, so the higher inflation, the lower the post-inflation return could be.
In terms of credit worthiness, we can think about two simple metrics. The budget deficit and the total stock of debt relative to the size of the economy. The table below, courtesy of Torsten Slok at Apollo Global Management, compares the primary budget deficit (government revenues less spending before interest costs) for a range of countries. On this metric, the UK doesn’t look great. It’s running a relatively large budget deficit compared to a number of its peers. It’s also interesting to note that some countries with historically weaker fiscal accounts actually look pretty decent on this metric – notably Greece and Portugal. It’s an important reminder that government budgets can improve, even if it’s not easy to do it.
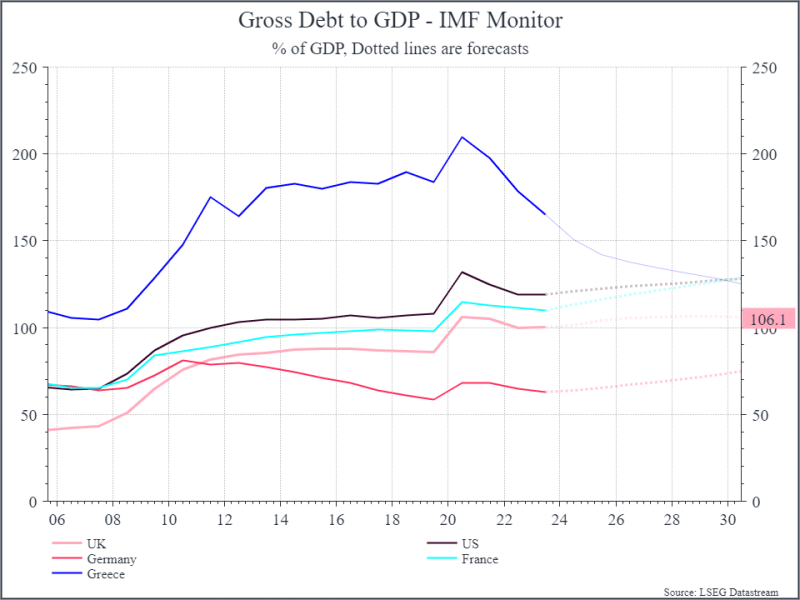
Turning to a measure of debt compared to GDP, the chart below shows the UK compared to the US, Germany, France and Greece. The dotted lines are forecasts from the International Monetary Fund (IMF). On this metric the UK looks in reasonable shape – its debt to GDP is high, but not out of line.
But the chart does show that the UKs debt level has worsened pretty sharply in the past twenty years.
Finally, we should highlight Greece, where debt levels are high compared to global peers, but they’ve begun to fall quite sharply.
Let’s come back briefly to inflation. The chart below shows annual inflation for the UK, EU and US. UK inflation has picked up in recent months, and looks to be heading towards 4% (compared to a central bank target of 2%). The optimistic view is that some of this is driven by rising utility prices that should be one-offs. The less charitable view is that with services inflation still sticky at around 5%, it’ll be tricky for interest rates to fall too far.
Where does looking at these metrics get us? There are a few points worth making. First, in some ways the UK doesn’t look like an outlier. We’ve seen rising bond yields across many developed markets.
Second, on inflation and the budget deficit, the UK looks a bit weaker than its peers, but not dramatically so. In terms of debt to GDP, we’ve seen a deterioration over the years – a legacy of fiscal spending during the Global Financial Crisis and Covid. That’s also true for a number of peers. But some countries have shown a marked improvement – notably in the so-called European periphery (Greece, Portugal, Spain etc) that were a focus of concern a decade ago.
What does it mean for portfolio positioning? We acknowledge the challenges in the UK fiscal accounts. The chancellor has a tough hand to play as we approach the budget, trying to generate growth while likely having to raise taxes. But we generally think that yields on UK gilts look interesting.
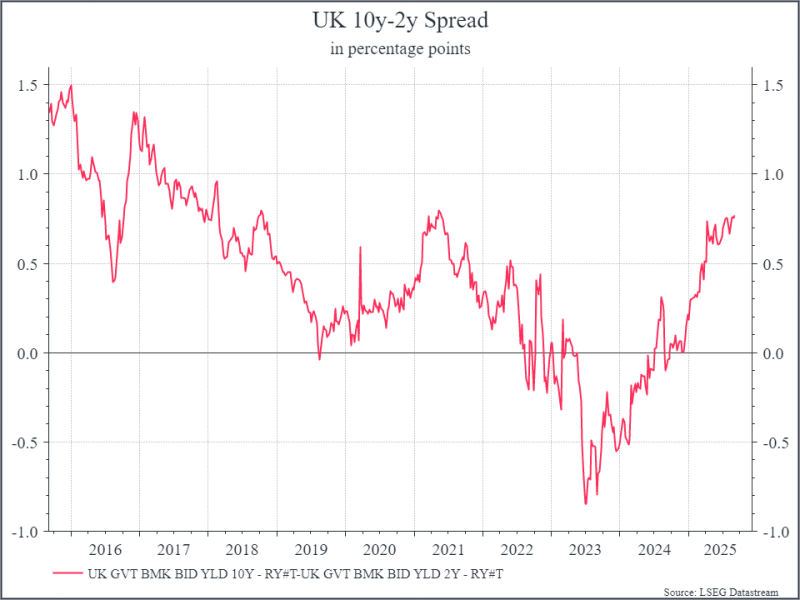
We continue to debate whether the case for longer-dated gilts has strengthened. We’ve generally favoured short-dated bonds, but the spread between short and long-dated yields has been rising (see chart below). For now, we prefer to stay focused on short-dated bonds for our UK debt exposure, but it’s something we’ll continue to monitor.
*As with all investing, financial instruments involve inherent risks, including loss of capital, market fluctuations and liquidity risk. Past performance is no guarantee of future results. It is important to consider your risk tolerance and investment objectives before proceeding.