


We thought a couple of events in the UK last week were worth commenting on—an interest rate decision from the BoE and UK GDP data.
First, the Bank of England left its policy rate unchanged. That was widely expected by investors. Two members of the Bank of England voted to lower rates – one more than was the case at the last meeting in March.
Second, the Office for National Statistics released its 1st quarter GDP report. The report showed that the UK economy grew a bit faster than analysts had expected. The economy grew 0.2% year-on-year, while analysts had expected a flat result.
On balance, that’s a decent outcome. The first UK rate cut is moving closer, while the economy appears to be exiting a fairly shallow downturn.
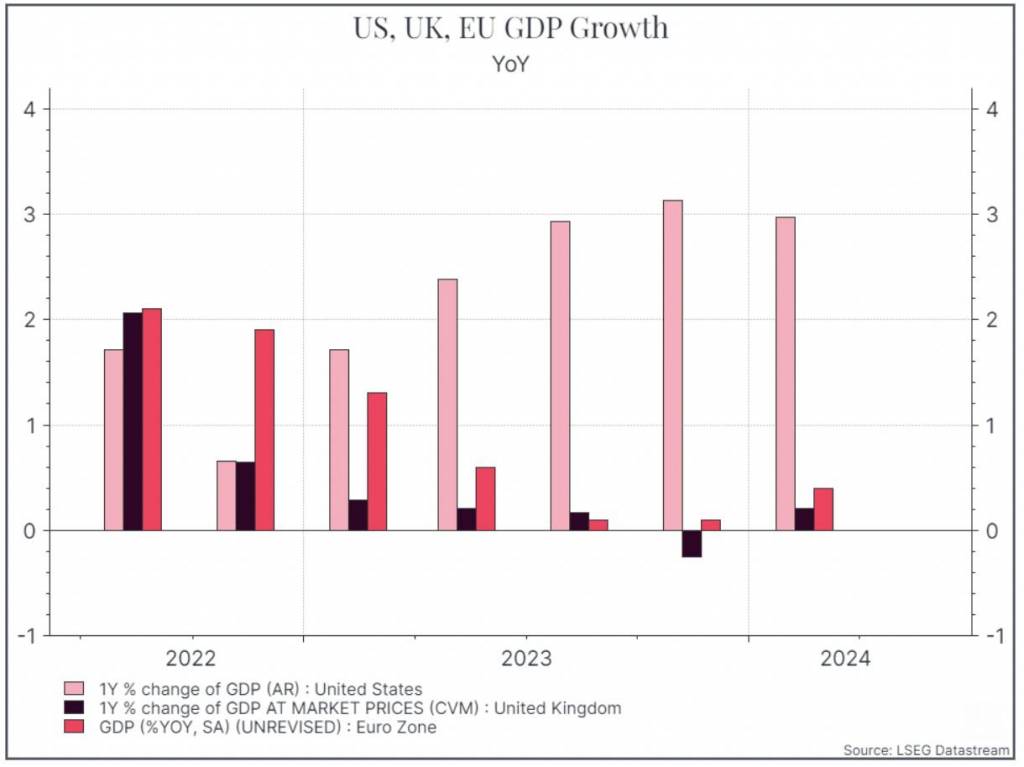
The picture doesn’t look so good when we compare the UK to the US and the EU. The chart below shows the US, UK and EU GDP. The UK has lagged behind both the EU and the US in terms of economic growth.
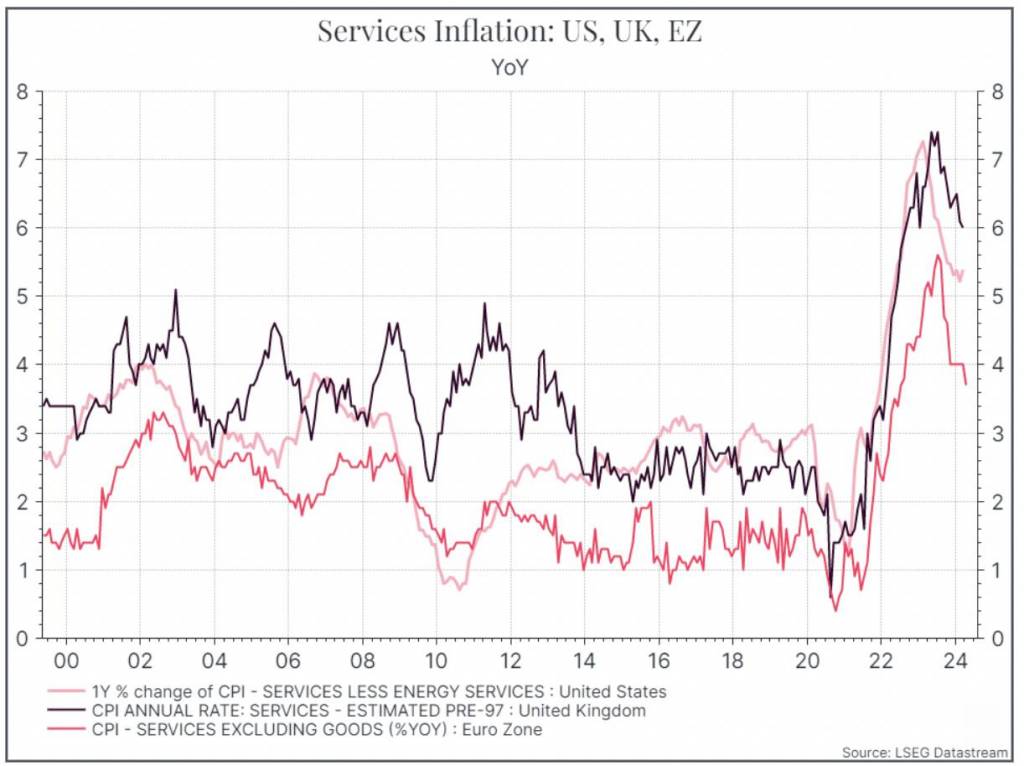
Similarly, the UK still has work to do on inflation. The chart below shows annual services inflation, which has become a particular focus of attention for Central Banks. Again, UK services inflation remains higher than the US and the EU—although all three Central Banks would like to see these figures continue to drift lower.
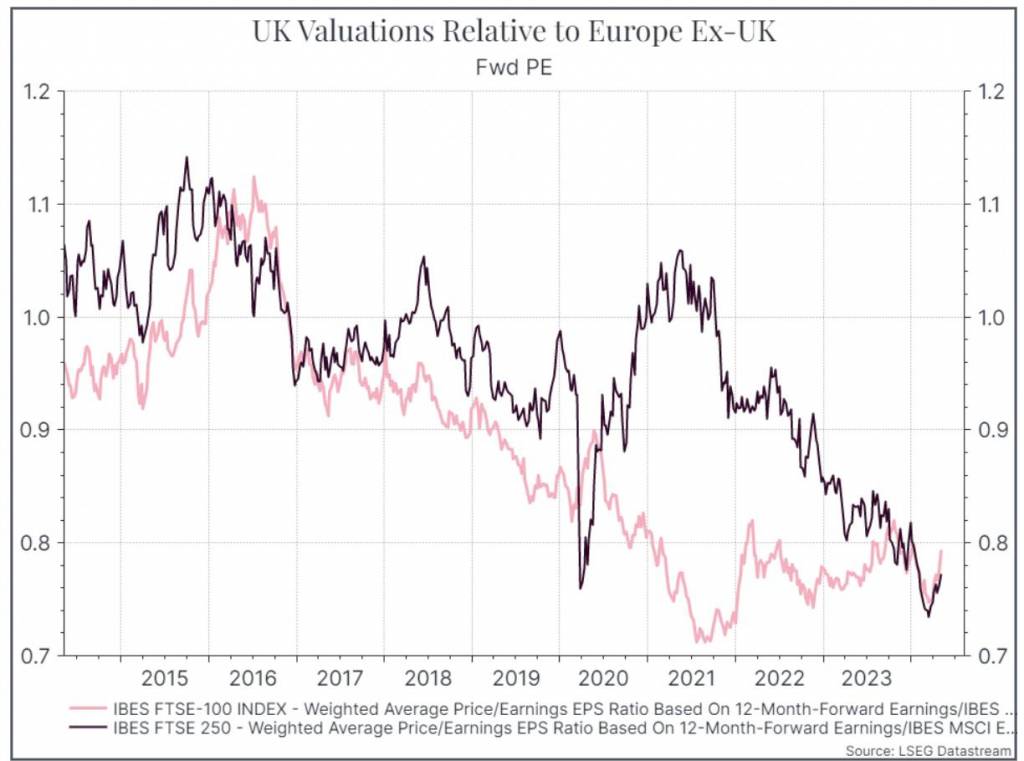
If the macro data in the UK is improving from a low base, the same might also be said for equities. The chart below shows UK equity valuations (forward Price/Earnings) compared to Europe Ex-UK.
The chart below shows the forward P/E of the FTSE 100 and the FTSE 250 relative to European equities (excluding the UK). In general, we can see a pretty clear de-rating over the past decade. Investors have been valuing UK earnings lower than those outside the UK. The contrast is often made between UK and US equities, but the valuation gap isn’t just restricted to the US.
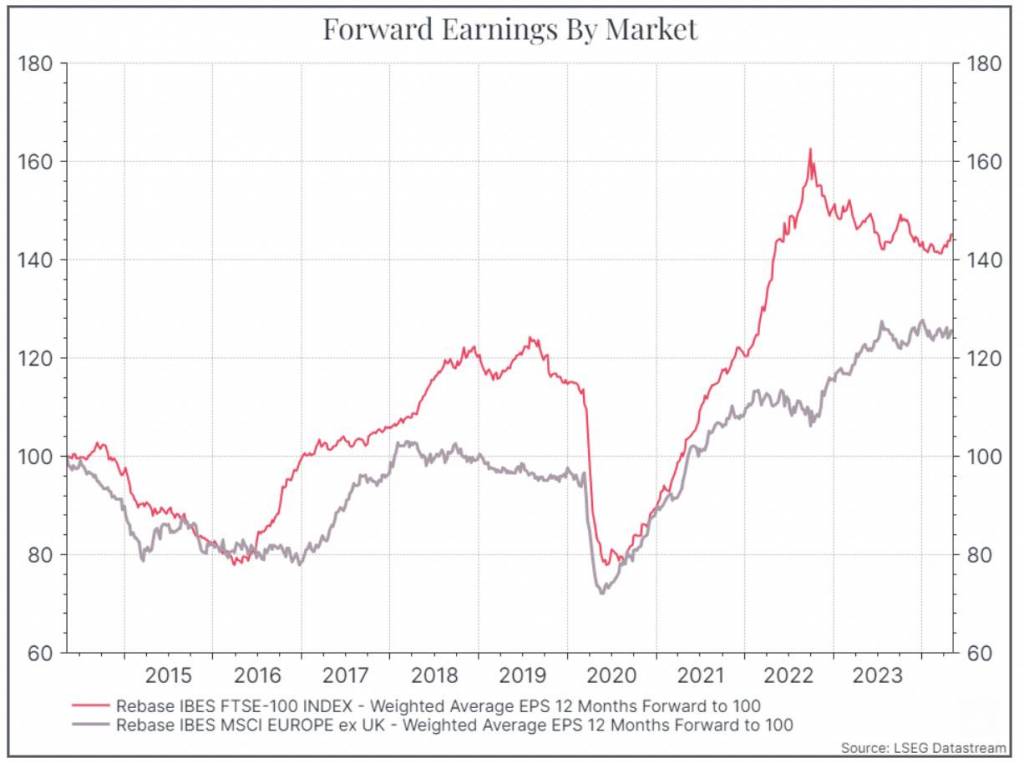
The de-rating might reflect slower earnings expectations. The chart below looks at expected future earnings for the UK and Europe ex-UK over the past ten years. The UK has outpaced the Eurozone on this metric, even if UK earnings have been largely stagnant over the past couple of years.
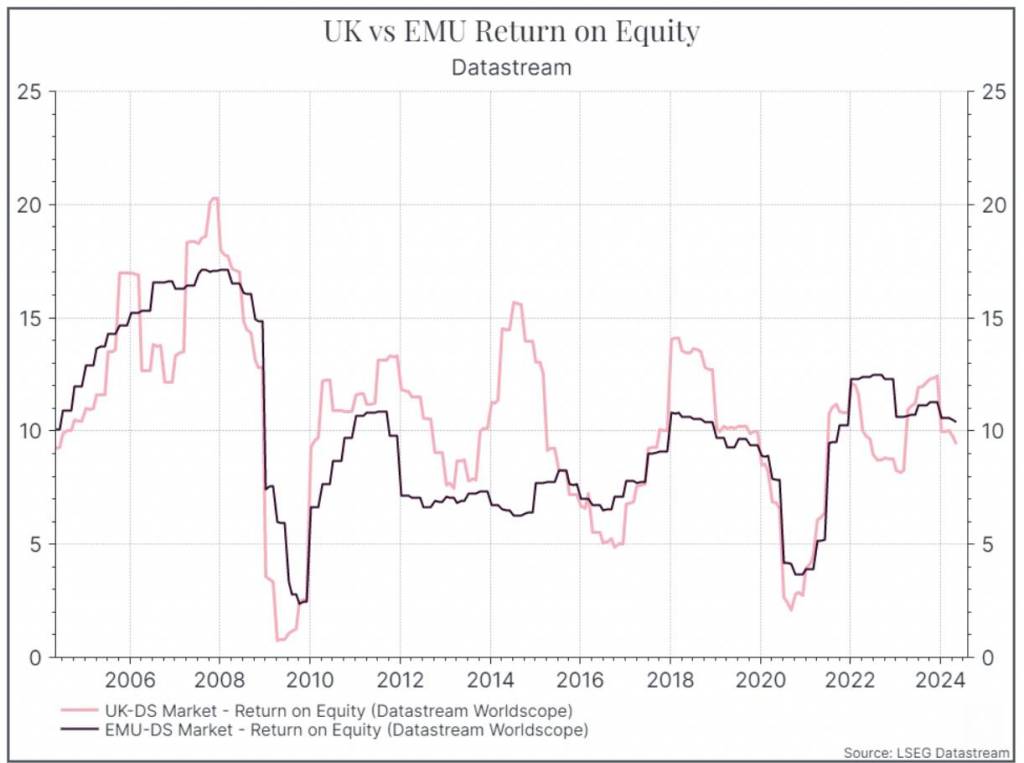
Finally, we could look at corporate profitability as measured by return on equity. In this case, we’re comparing the UK against EMU countries (Austria, Belgium, Finland, France, Germany, Ireland, Italy, the Netherlands, Portugal and Spain). The data doesn’t show much difference over the past few years. UK and EMU corporates shows a fairly similar Return on Equity.
So, where does this get us? We’ve seen some marginally good macro news out of the UK this week—albeit from a low base. At the same time, UK equities look fairly cheap, not just compared to the tech-heavy US market but also compared to European assets. It might not warrant a large position, but we shouldn’t completely give up on UK assets just yet.
*As with all investing, financial instruments involve inherent risks, including loss of capital, market fluctuations and liquidity risk. Past performance is no guarantee of future results. It is important to consider your risk tolerance and investment objectives before proceeding.