Caught in the grip of global geopolitics and grappling with the crisis of globalisation, the European Union finds itself needing to reinvent its role in the world, not only politically but also economically.
Since 1992, the year in which the Maastricht Treaty was signed, it seems like a century has passed. The European dream has been on a rollercoaster ride: after a period of great momentum toward integration, culminating in the adoption of the Euro, came the 2008 financial crisis and, especially, the 2011 debt crisis. Brexit, voted on in 2016 and executed in 2020, saw the second-largest economy in the Union leave the bloc.
In short, Europe’s momentum seems to have waned, and in academic and journalistic circles, critical analyses have proliferated, emphasising the limitations of the European Union rather than its prospects. Even the recent crises, such as COVID-19 and the Russian invasion of Ukraine, which strengthened continental governance, do not appear to have altered this narrative.
In this article, we will attempt to conduct an economic analysis of the Union, with particular attention to the trends and structural limitations that are undermining its performance. This article does not claim to provide a definitive analysis of the economic prospects of the European Union, nor does it aim to critique the integration process politically. It is a partial analysis that focuses on the structural limitations of the Old Continent’s economy rather than its strengths. It goes without saying that Europe remains one of the geographical areas with the greatest resources and potential on the planet, but in this context, we find it useful to concentrate on the challenges to answer the question: Is Europe truly becoming poorer?
The wealth of Europeans
If we look at average wealth (calculated by subtracting debts from assets, including real estate values), Europe remains one of the wealthiest regions on the planet, even though North American countries and some countries in Southeast Asia have surpassed the major European economies for quite some time now. The per capita wealth of Europeans, also bolstered by high real estate values, remains one of the highest globally, second only to North America (considering that the wealth per adult figure also includes Eastern European countries).
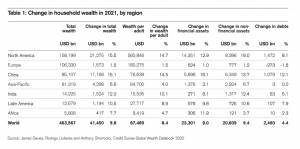
In other words, this data allows European citizens to find themselves quite comfortably in the upper-middle class of the world, as evidenced by the chart placing the wealthiest segments of the global population on the right side. The average wealth of a European citizen amounts to $106,000, which would position the average European close to the top 10% of the global population in terms of wealth. It’s worth noting the high incidence of Europe and the United States in the lower deciles, mainly due to younger generations dealing with high levels of debt.
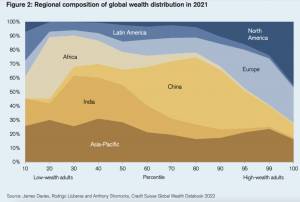
The wealth in Europe has very ancient roots. The process of economic transformation that some historians call “the great enrichment” began right in Europe, turning the Old Continent into an economically dominant region. Europe was able to maintain this primacy for centuries, both institutionally, financially, and technologically, through colonialism. However, the 20th century saw the emergence of more dynamic economies, a trend that has become even more pronounced in recent years, with the European economy clearly losing ground compared to other geographies.
This trend is well illustrated by income and aggregate income (GDP) metrics. In 2008, the EU economy was slightly larger than the American one: over $16 trillion compared to $14.7 trillion. In 2022, the US economy has grown to $25 trillion, while the EU and the UK together have reached ‘only’ $19.8 trillion. The American economy is now more than a third larger. It is over 50% larger than the EU alone.
This result is the outcome of a constant slowdown in the growth rate that reached its peak in the last decade. Data from the European Central Bank shows that the average annual economic growth rate in Eurozone countries decreased from 3.4% in the 1970s to 2.4% in the 1980s, 2.2% in the 1990s, and 1.1% until 2010, before falling below 1% in the following decade. Having such a low growth rate for an extended period means losing productive capacity, and this, sooner or later, starts to impact the well-being of the population.
Productivity crisis
Looking at the dynamics of productivity, which is one of the fundamental factors for comparing the GDP of different countries, we see that in Europe, the productivity rate is slowing down both in absolute terms and relative to that of the United States. Analysing the contributing factors sheds light on one of the possible reasons why the European economy is losing ground. In the United States, despite the slowdown, what emerges is that productivity growth has been driven by Total Factor Productivity (TFP). To simplify, Total Factor Productivity is a metric that measures the extra production with the same input factors (capital and labour); it is considered an estimate of the technological advancement of the industrial system. In other words, while estimates and indicators are not without limitations, they clearly indicate a lag in terms of innovation among European companies. Even when looking at frontier firms – the top 5% of the most productive companies – in the manufacturing sector, we notice that they have significantly reduced their productivity growth rates.
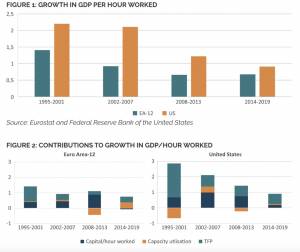
The slowdown in the growth rate is reflected in per capita GDP. To provide a benchmark, the Gross Domestic Product per person in the United States is nearly $70,000. The only European countries where it is higher are Luxembourg, Switzerland, Norway, and Ireland, where the data is distorted by the many companies that have relocated there for tax reasons. In Germany, the leading European economic power, per capita GDP (adjusted for purchasing power parity) is $58,000. This places it at the same level as Vermont but well below New York ($93,000) and California ($86,000). The comparisons are even less flattering for other European countries. In the UK and France, incomes are on par with those in Mississippi ($42,000), the poorest state in America.
The demographic crisis
Looking to the future, one of the factors determining long-term growth prospects is demography, and the European Union is currently experiencing a decline in its population. Demographic projections indicate that the EU is headed towards a significant reduction in its population by the end of the 21st century. According to estimates provided by Eurostat, the bloc could witness a 6% decrease in its population, equivalent to 27.3 million fewer people, by 2100.
After two years of demographic decline primarily caused by the COVID-19 pandemic, the European population began to recover in 2022, reaching an estimated 451 million people at the beginning of this year. However, this growth is largely attributed to the massive influx of Ukrainian refugees. The EU’s statistical office suggests that the population of the European Union might continue to grow slightly, reaching a peak of 453 million people in 2026. Nevertheless, this growth would be temporary, and it is predicted that the EU’s population will begin to decline, settling at 420 million by 2100.
These demographic projections are based on various factors, including fertility rates, mortality rates, and migration patterns. The decline in population is accompanied by an ageing population. In 2100, individuals aged sixty-five and older could make up as much as 32% of the total population, compared to 21% in 2022. This trend represents a significant shift in the demographic structure, with projections indicating more people over the age of 80 than those under 20. The consequences for welfare and the labour market are significant, and managing them will increasingly weigh on European budgets in the future.
These demographic projections come at a time when China has experienced its first demographic decline in six decades, with a negative balance between births and deaths. The positive side is that life expectancy in the EU has significantly increased over the past century, rising from 69 years in 1960 to 80.1 years in 2021.
Energy independence
In 2022, Europe successfully addressed the energy challenges stemming from its dependence on Russia, but the issue of energy independence and supply chain security has come to the forefront for a continent with few natural resources and raw materials. The Russian invasion of Ukraine highlighted the EU’s dependence, leading to a drastic reduction in gas exports and a considerable drop in weekly flows from 3,500 million cubic meters to just 500 million. In response to this situation, Europe took a decisive approach by imposing an embargo on Russian coal, crude oil and petroleum products, with the aim of significantly reducing its dependence on these resources. As a result, Europe’s dependence on Russian gas (which accounted for 40% of consumption), oil (25%), petroleum products (15%), and coal (60%) has been significantly reduced in 2023.
However, this success has come at a significant cost. Energy prices have increased significantly, with a direct impact on households and industry. Some countries have had to bear fiscal costs equivalent to several percentage points of GDP, totalling hundreds of billions of euros in the EU. These impacts have not been evenly distributed across sectors, incomes and countries, highlighting the political and socio-economic challenges associated with such a transition. If the problems are not the same for everyone, finding common solutions becomes more complex. Energy prices in the EU are considerably higher than before the crisis, both in absolute terms and compared to other regions of the world, such as the US. Higher energy prices, of course, lead to a loss of competitiveness across industries.
In the long term, the EU faces the challenge of decarbonisation, which can become an opportunity. However, current policies are not fully aligned with this vision, and substantial investment in energy markets and infrastructure will be needed to achieve ambitious goals. EU energy planning is complex, guided by goals and regulations at both European and national levels. The energy transition remains a difficult challenge that requires effective governance and cooperation between member states with different energy mixes and objectives.
The innovation gap
Innovation in Europe is at the centre of numerous challenges that require deep reflection. It is not always easy to measure the level of innovation and its impacts on an economy. Often, company spending on Research and Development (R&D) is relied upon as a key indicator of input for innovation. In this regard, Europe set a goal of 3% of GDP for R&D spending as far back as 2002, and this goal was reaffirmed in the EU’s 2020 strategy, indicating that not much progress has been made since then.
But innovation spending is not limited to R&D; it also includes the adoption of innovations by companies. In this context, it is concerning to note that the number of companies involved in innovative activities is constantly decreasing. A closer analysis of R&D spending reveals that it is carried out by a few large companies. For example, if we look at the data on R&D spending by European companies in 2015, we see a highly uneven distribution: the top 10% of the largest companies account for 77% of total spending, while the top 1% of companies account for nearly one-third of all R&D spending in Europe.
Limited investments have had the consequence of preventing European champions from establishing themselves internationally. The seven largest technology companies in the world, by market capitalization, are all American, and there are only two European companies among the top 20. Even when looking at frontier sectors like artificial intelligence, we find the dominance of U.S. and Asian industries over European ones. This situation is not favoured, among other things, by a fragmented capital market that makes it challenging to secure the necessary scale of funding to compete with international counterparts.
If we look at the composition of the main stock indices, we can see that the technology sector accounts for less than 10% of the market index in Europe, while in Asia, this threshold is significantly exceeded, and in the United States, the sector accounts for around 30% of the index. Europe performs better in more traditional sectors and those related to luxury and lifestyle, where European companies dominate global markets. The problem with these industries is that they are more cyclical and exposed to foreign exports.
In other words, it appears that a limited number of companies are able to fully exploit the opportunities offered by new technologies, while many others lag behind. These data suggest that Europe must address the challenges of innovation systematically, creating a favourable environment for even small businesses that want to participate. This is a fundamental step if the European Union wants to protect its way of life, welfare, and its status as a geographically wealthy area in the long term.
*As with all investing, financial instruments involve inherent risks, including loss of capital, market fluctuations and liquidity risk. Past performance is no guarantee of future results. It is important to consider your risk tolerance and investment objectives before proceeding.
