


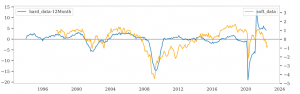
What are we talking about? The AAT has been struck in recent weeks that macro data has been coming in a bit better than expected. It’s not great, but it’s not disastrous and we wondered if perhaps we were all worrying a bit too much. With that in mind, we built a couple of indices, comparing “soft” data – things like surveys – and “hard” data – actual economic results – like industrial production or retail sales. We’ve started with US data, building on work done by the Federal Reserve – thanks to Bob and Jack for all the work on this.
What did we learn? Time for some charts. The first chart shows the two indices and seems to confirm our impression. Hard data has so far held up better than soft data. Maybe it’s not a huge surprise, sentiment has been pretty poor in recent months after all, even if unemployment is very low. But it’s also worth noting that we’ve seen this before. During the Great Financial Crisis, we can see that sentiment indicators led the actual macro data, deteriorating a couple of months before the crisis was reflected in the real economy. And, we’ve also seen the reverse, there was a greater sense of optimism in the pre-pandemic period than the macro data would have warranted – possibly reflecting a combination of low inflation and low unemployment.
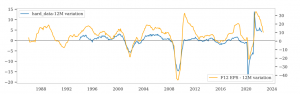
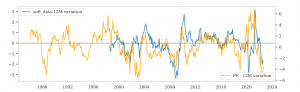
We’ve also tried to tie these variables back to equities. The first chart shows the relationship between hard data and the change in forward earnings. The second chart below shows the relationship between soft data and the change in the forward P/E ratio. The punchline is that earnings follow the hard data, but valuations track the sentiment indicators. That makes sense, if you believe that short-term valuation moves are really about sentiment rather than anything more fundamental – the market acting as a voting machine, rather than a weighing machine.
Where does this get us? It’s tough to extrapolate too much, but there are a few points worth making – with appropriate caveats. First, we are seeing a difference between soft and hard data. Second, we’ve seen it before and it’s reasonable to think that the soft data is a bit more of a leading indicator, rather than concluding that we’re willing ourselves into a recession. Third, the relationship between hard and soft data, and equities suggests that even if we’ve seen a de-rating, we probably haven’t seen the end of earnings downgrades. On the margin, that probably supports keeping a more cautious stance.
*As with all investing, financial instruments involve inherent risks, including loss of capital, market fluctuations and liquidity risk. Past performance is no guarantee of future results. It is important to consider your risk tolerance and investment objectives before proceeding.