


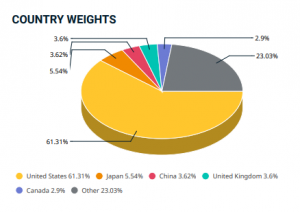
What are we talking about? We spend quite a lot of time thinking about US equities. US equities make up around 60% of a standard global equity benchmark (see below a pie chart for MSCI All-Country World Index).
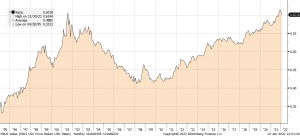
That figure has steadily grown in recent years. The chart below shows the weight of US equities within a standard global equity benchmark – peaking during the “dot-com” era, but rising steadily in percentage terms from low-40s in 2007 upto around 60% today.
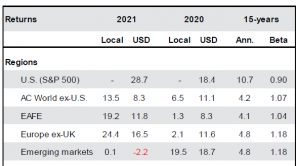
Thinking in terms of returns, the table below (from JP Morgan) highlights how much the S&P 500 has outperformed the rest of the world. Your US equity exposure had a lot to do with your overall performance over the past fifteen years.
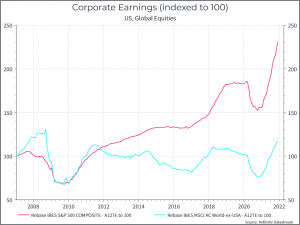
How did they get there? A couple of charts tell the story for us.The first shows an index of corporate earnings for the US and Non-US equities, and the clear outperformance of US corporate earnings.
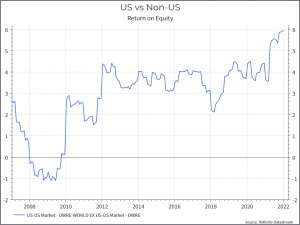
The second chart uses a different data source but shows the Return on Equity of the US market relative to the rest of the world. It shows that the US market has been a more profitable place pretty consistently over the past ten years, thanks in part to the presence of the large tech platforms.
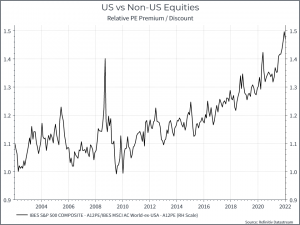
So the combination of faster growth and higher profitability is very crudely a recipe for out-performance. And the third chart reflects that. This shows valuations – in this case the forward Price / Earnings ratio of US equities compared to the Rest of the world. US equities have steadily re-rated, in terms of their P/E valuation since the Financial Crisis, as they’ve grown their earnings faster and with a higher return.
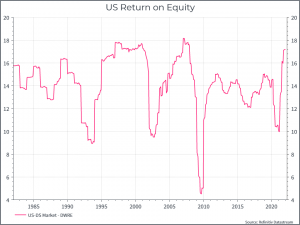
What could happen now? There are lots of good reasons to explain the outperformance of US equities over the past decade. The question we’re wrestling with is whether they’ll continue into the future. US corporates have grown faster and generated higher returns, but can that return improve? The chart below suggests that a return on equity could sustain at this level, but hasn’t really gone much higher.
Similarly, the premium that US stocks trade relative to non-US equities is also at an all-time high, but that’s been true for the last several years! And in terms of its weight, US equities have rarely been such a large percentage of the global market cap over the past forty years (it was higher in the 1960s) . Sometimes people remember Japan at its peak in 1989, when it accounted for 44% of global market cap, but aggregate valuations (at least in terms of crude forward P/E) in Japan were far higher than is the case today in the US.
We’ll continue to have a significant weight in US equities (it’s currently a bit below 60% of our equity exposure in most portfolios) and that’s well supported by the strong profit growth we continue to see. But the gap, notably in terms of valuation, between the US and its global peers suggests there could be benefits to maintaining broad global equity exposure.
*As with all investing, financial instruments involve inherent risks, including loss of capital, market fluctuations and liquidity risk. Past performance is no guarantee of future results. It is important to consider your risk tolerance and investment objectives before proceeding.