


There were a couple of important data releases this week. Most notably, we saw a better-than-expected inflation print for July in the United States. Headline inflation slowed to 3% year-on-year, slightly lower than forecast. The result prompted some optimistic comments from US central bankers and does suggest that we could see a rate cut in September.
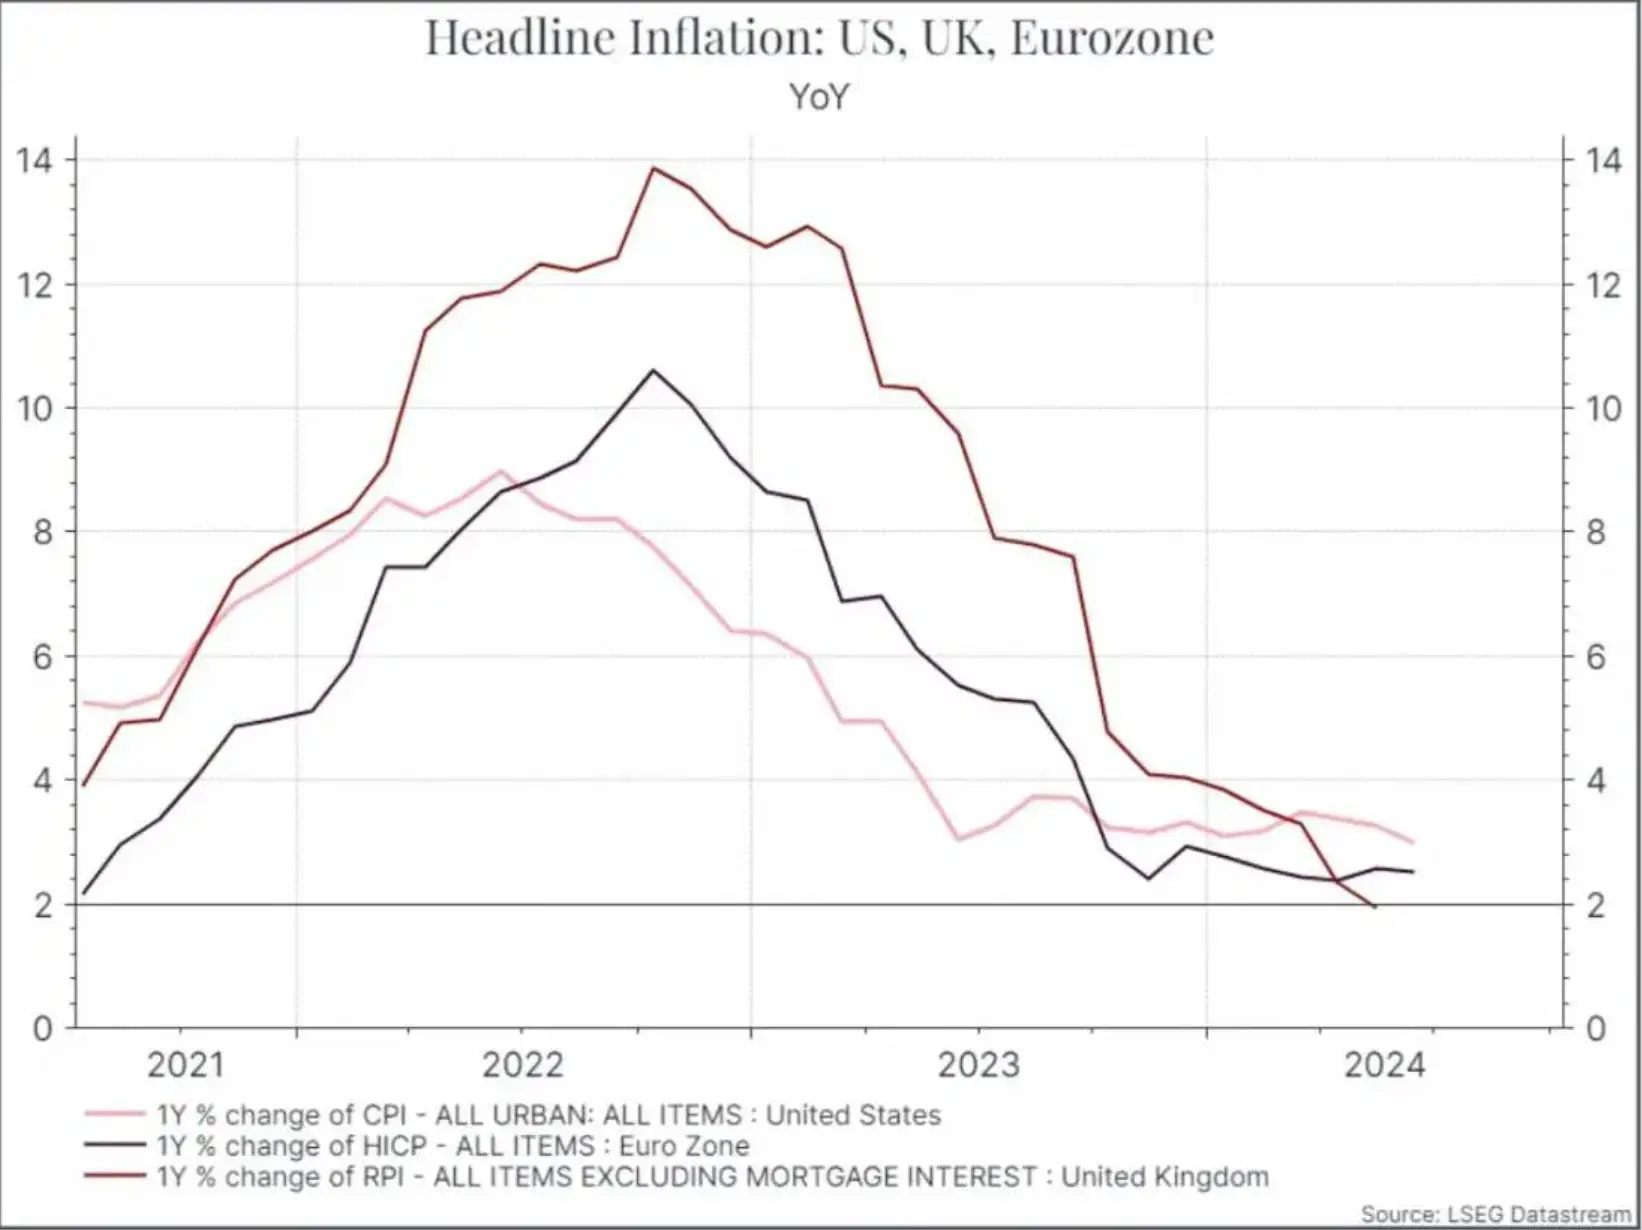
Let’s put this result into context. The chart below shows headline inflation for the US, Eurozone and the UK. It shows that annual US inflation has proven quite sticky over the past year or so, above 3%. The UK and the Eurozone have shown marginally better results on inflation, perhaps at the cost of slower economic growth.
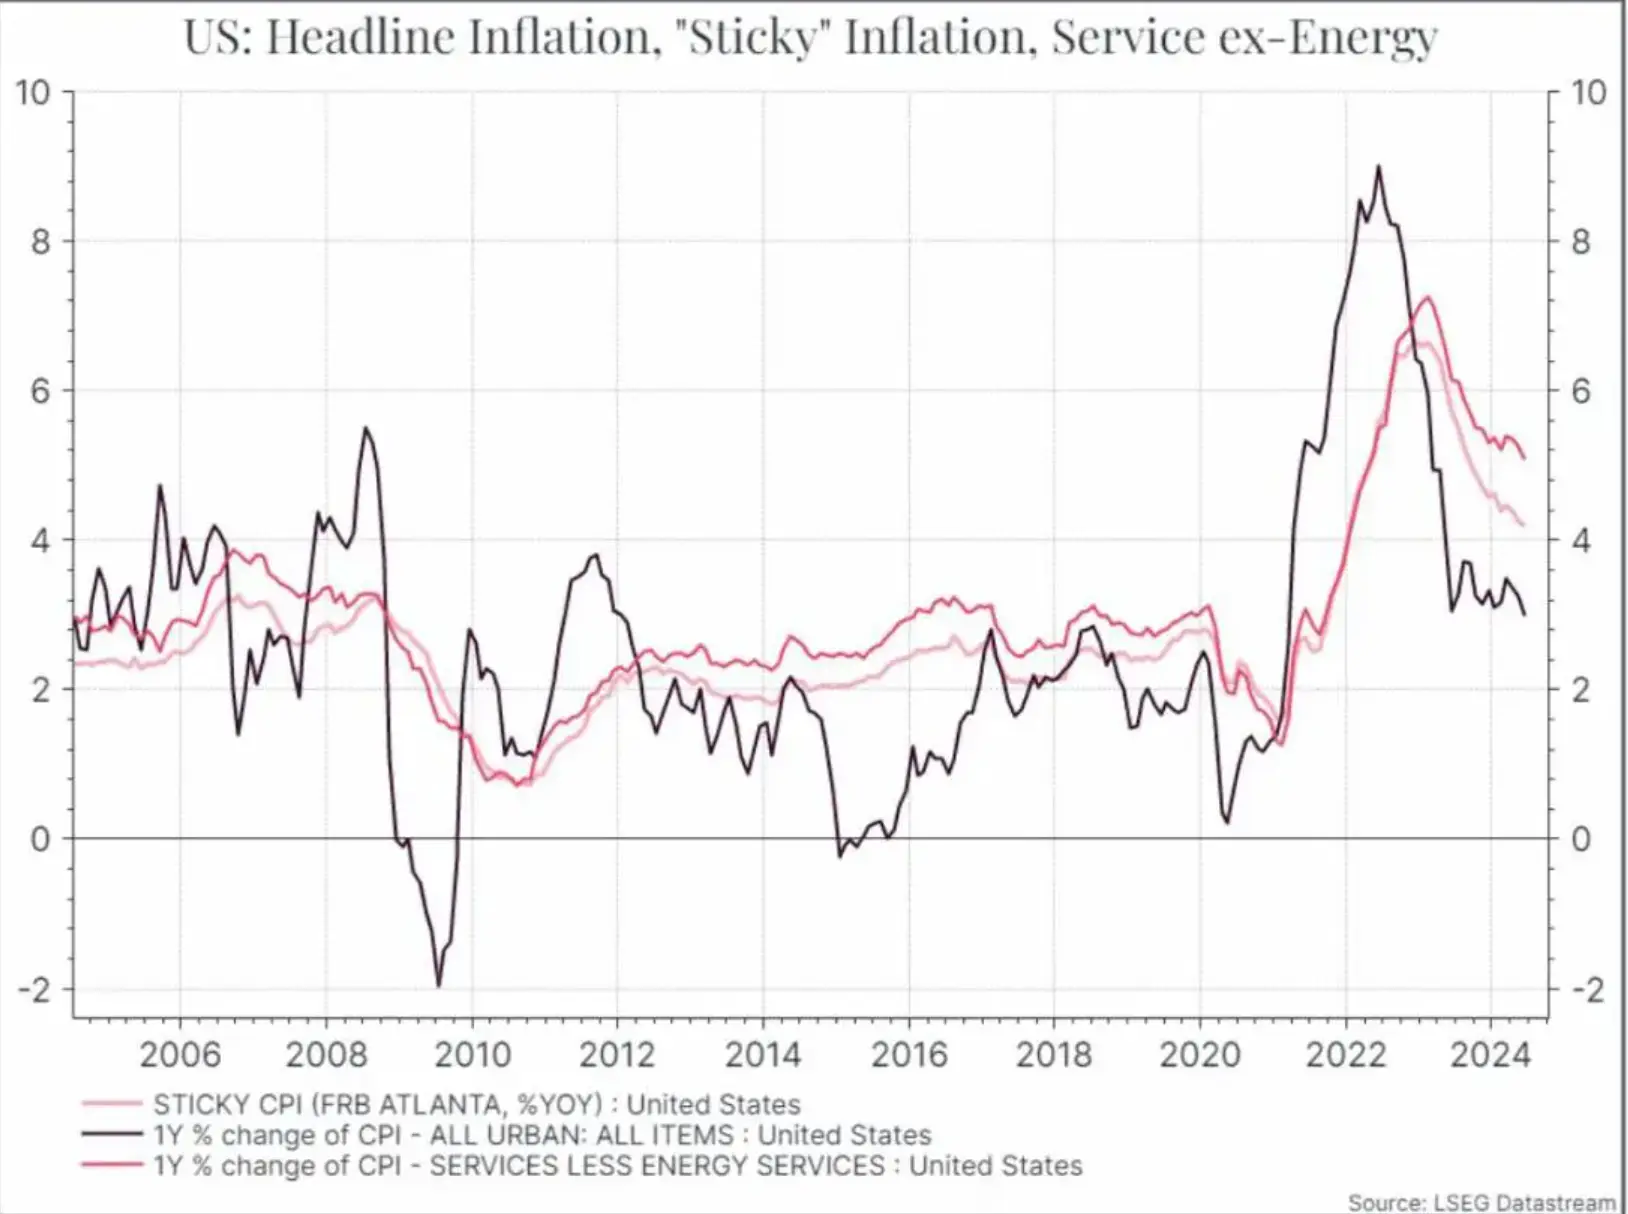
Digging into the details a bit more, we can see further signs of progress. The chart below shows the headline inflation rate for the US, along with a measure of “sticky” inflation (components that are slower to move) and services inflation. As the name suggests, “sticky” inflation has been slower to come down, but we can see a steady improvement over the past few months for that metric and services. That should give central bankers some comfort that the slowdown in inflation is becoming a bit more broad-based.
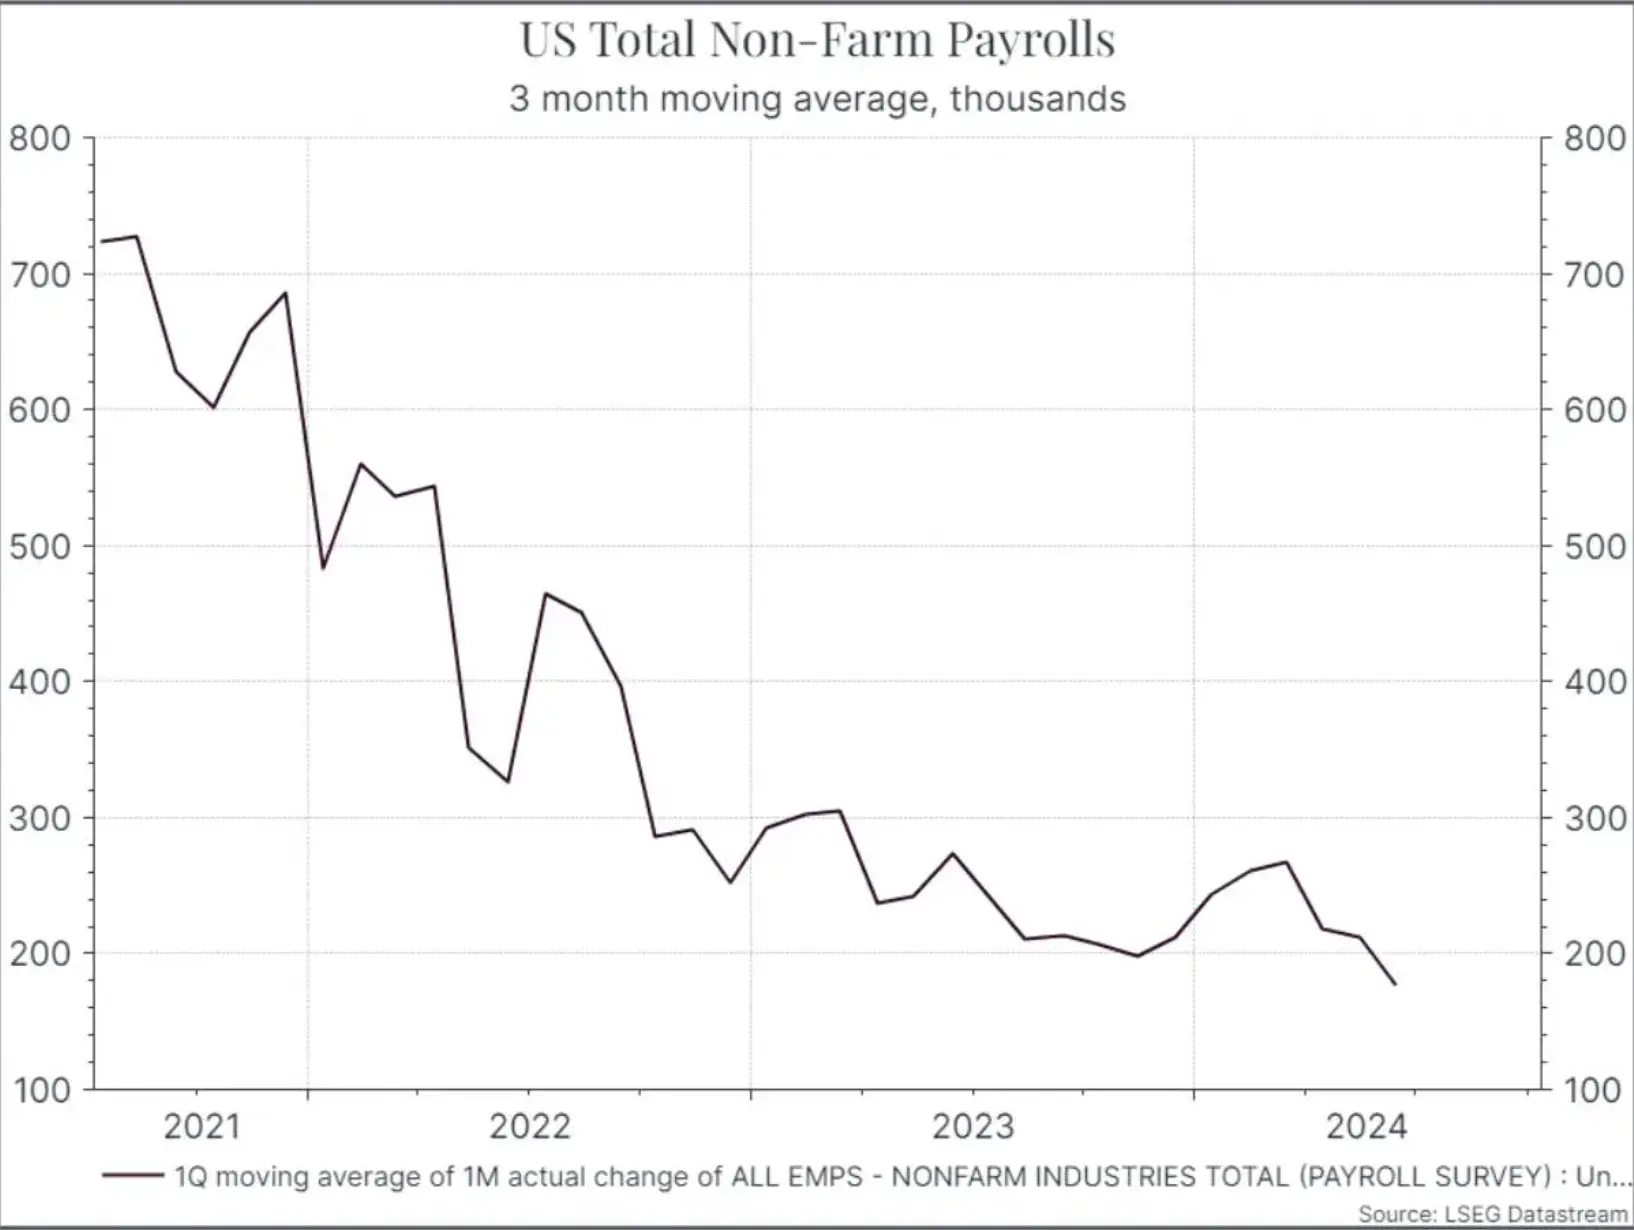
We shouldn’t read too much into one good number and US inflation is still above the 2% target. But we are seeing signs of a slowdown elsewhere in the US economy. Job creation has slowed down, as the chart below indicates, and the unemployment rate in the US has risen above 4%.
Slower inflation and rising unemployment should give the Federal Reserve enough reason to lower rates at their September meeting.
*As with all investing, financial instruments involve inherent risks, including loss of capital, market fluctuations and liquidity risk. Past performance is no guarantee of future results. It is important to consider your risk tolerance and investment objectives before proceeding.