The new year started well for financial markets, and the S&P 500 climbed over 7% to yet another new record within the first three weeks. But it was stronger-than-expected economic data from America that brought this rally to a swift end.
The return of volatility has left global markets rather bruised, with performance for all the main asset classes negative after the first three months of the year.
The Vix, a popular measure of volatility on the S&P 500, sunk to historic lows in 2017 as financial markets ignored geopolitical noise and growing uncertainty. The Vix averaged just 11.16 last year. By the end of January 2018, this had nearly doubled to 20.65, taking the first quarter average to 17.
What happened to financial markets?
US equities
All US equity markets struggled in the first quarter, with the S&P 500 down 1.22% after an initial rally to new record highs was wiped out. In fact, it was only the emerging market sector that grew in the equities space, up around 2%.
UK equities
Looking closer to home, the FTSE 100 slumped 8%, exacerbated by sterling’s rally against the dollar, which rose 4.71% in the quarter. As most of the profit from the blue-chip index are generated in dollars, the higher the pound is valued, the less companies will get when they translate their profits into sterling.
US bonds
Reaching a three year high, 10-year US yields touched 2.82% in the first quarter, reflecting a strengthening economy and rising expectations of interest rate hikes. The yields on two-year US bonds rose to its highest level since 2008 at 2.29%.
UK gilts
In the UK, the yield curve flattened as two-year gilts rose on expectations of higher rate hikes from the Bank of England, but uncertainty over the UK’s post-Brexit future weighed on growth in 10-year yields and pulled 20-year yields down 3 basis points.
Why has volatility returned?
It was stronger than expected economic data from the US that awoke global markets from their slumber, signalling to investors that the low interest rate global economy may be coming to a quicker and more aggressive end than initially thought. Rising interest rates can clip economic growth and restrict corporate profit growth.
Geopolitics
Markets now seem to be focussing a lot more on geopolitics than they did in 2017, and there’s been a lot to contend with. Closer to home, Brexit negotiations haven’t made the progress many had expected, with uncertainty weighing on business investment and consumer confidence. The Italian elections highlighted just how influential populist parties are in European politics.
Tech and Donald Trump’s trade policy also weighed on financial markets, both of which had a negative impact on financial markets and potentially on the global economy more broadly.
Trump’s trade talks
After Trump announced his first wave of tax reforms on Chinese imports, it was clear that China would retaliate, with real fears that a trade war could boil over.
Whilst we’re seeing an escalation in tariffs implemented by both sides, it’s too soon to say whether we’re in the midst of a trade war.
If Trump decides to sign a few blank cheques for infrastructure spending, there could be short-term economic benefits to his policies, but it’s widely thought that a trade war will have negative implications for long-term economic growth. There’ll inevitably be winners and losers, but in totality the impact is likely to be negative.
Most mainstream economists believe global trade is good for a healthy economy, and it’s unlikely China or America actually want to see a sharp deceleration in economic growth.
It’s not just Trump’s trade policy that’s caught investor attention. There’s the Special Counsel’s Investigation, regular White House reshuffling and mid-term elections for the House and Senate coming up.
Why is tech so important?
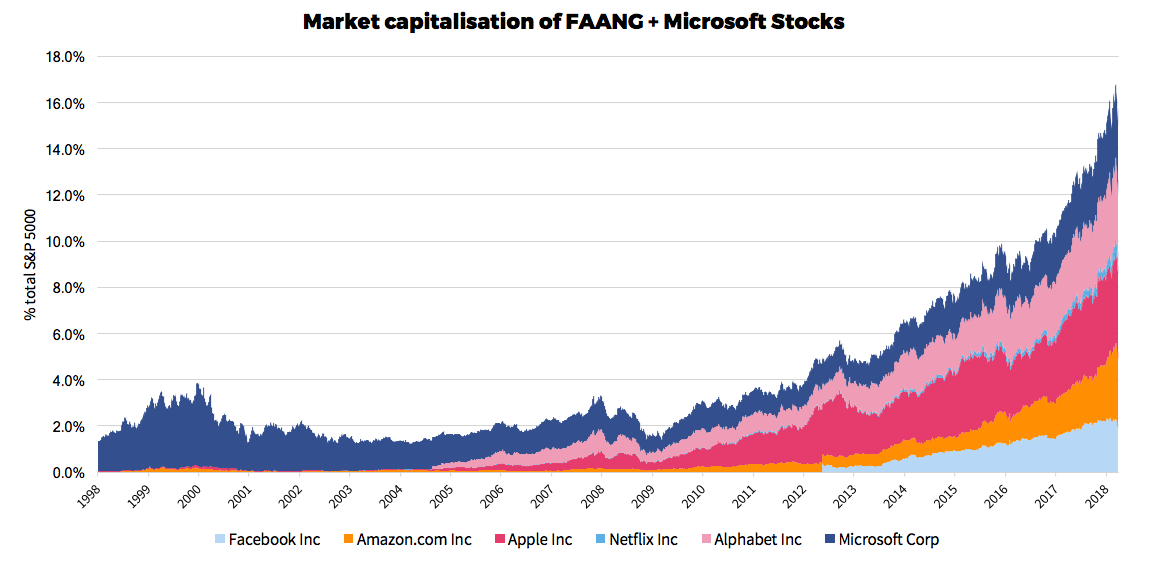
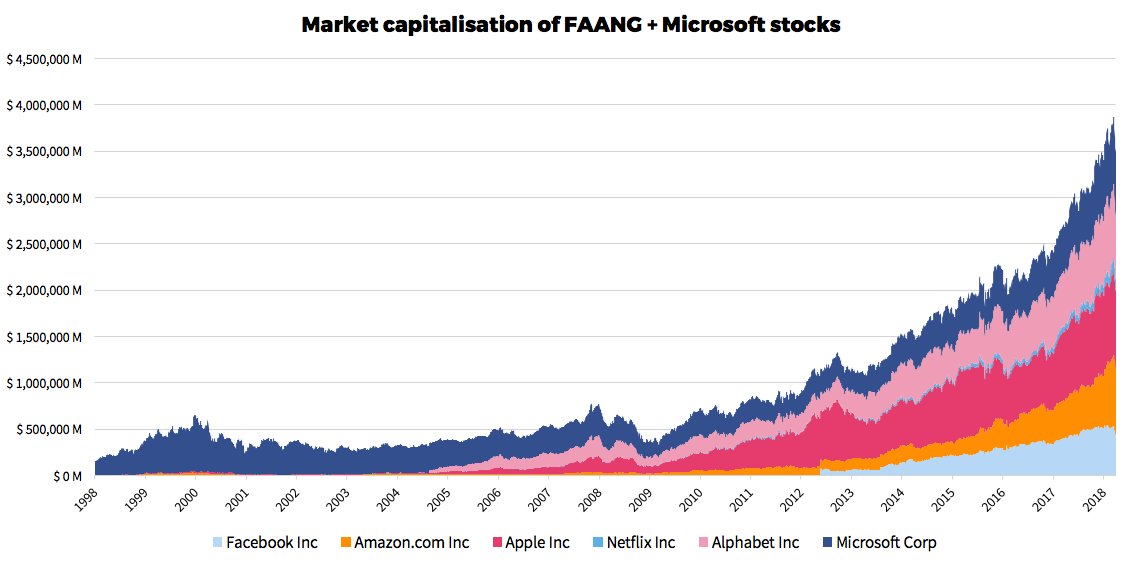
The global tech sector has had a phenomenal few years. The rapid growth of FAANG (Facebook, Apple, Amazon, Netflix and Google/Alphabet) stocks highlights the rapid transformation to a digital-first world. Add in Microsoft and the tech boon has seen these six giants gobble up an increasing share of the S&P 500.
If you look back just 20 years ago, only Apple and Amazon had actually floated on the stock market – with the latter the new kid on the block. The total market capitalisation of the listed companies as a share of the S&P 500 was under 2%, with the bulk of this attributed to Microsoft.
The momentum behind these stocks kicked into full swing from 2013, with the group’s share of the S&P 500’s market capitalisation jumping from around 4% to nearly 17% today.

Tech has dominated financial news over the last few weeks, triggered by concerns over how Facebook and Cambridge Analytica used user data. The scandal has wider implications for consumer behaviour and regulation, and how these could impact growth and profitability.
The market capitalisation of the FAANG stocks and Microsoft have shot from just over $1 billion in 2013 to nearly $4 billion today.
With FAANG stocks having a firm grip of the S&P 500, any wobble in investor confidence will be felt throughout the index. With the S&P 500 a benchmark for global markets and a favourite in diversified portfolios, the impact will be far reaching.

Tighter regulation doesn’t necessarily spell game over for tech stocks though; in fact, it could play well into the hands of these behemoths.
Whilst regulation may make it more difficult for these companies to grow, it will also make life tough for their smaller competition as it becomes harder for smaller players to deal with the demands of privacy.
The market value of these tech stocks might suffer over the short-term as they adjust to a new paradigm shift in terms of regulation, but this is unlikely to significantly weaken their strong grip of the S&P 500 for some time to come.
What does this mean for your investments?
It’s a well known mantra that it’s ‘time in’ not ‘timing’ the market that maximises your long-term returns. JP Morgan’s famous study shows that if you miss the 10 best days of performance on the S&P 500 over a 20-year period, your return falls from an annualised 10% to just over 6%.
Take a look at research from Barclays and you’ll see that stocks and shares ISAs outperform cash ISAs 91% of the time.
A long-term horizon can help you ignore short-term fluctuations and maximise your returns over the long run.


