The yield curve reflects the interest rate government’s have to pay when borrowing money over different time periods. US Treasury yields are closely watched by markets around the world, but what does it really show investors?
The yield curve
When governments, corporations, or individuals borrow money, they are usually required to pay an interest rate on top of repaying the loan back, to benefit those lenders taking on the risk by loaning money. The yield is essentially the return an investor realises on a bond.
US treasuries are popular with investors, not only because they are amongst the most liquid financial assets, but they are generally regarded as a risk-free asset for dollar investors and they act as a benchmark price for many other assets.
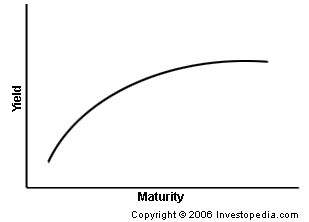
The US government borrows money over several different time periods, predominantly one year, two years, five years, 10 years and 30 years. Each of these time horizons will have different rates attached to them. Input these different rates into a chart and you get the yield curve.
Theoretically, the longer the time period the higher the yield as there is a greater risk that the borrower may not repay the loan, will default on their interest rate payments, or the investor could get a better return elsewhere. Reflect this in a chart and you’ll see something similar to the chart below, a normal yield curve – thanks to Investopedia for the chart.

However, as the global economic backdrop changes, so does the perception of risk for investors. Treasury bond prices reflect some view of what will happen in the future, which is then reflected in the yield curve.
The curve can then flatten, or become inverted, as investors require a higher return on shorter-term bonds. Essentially, investors see shorter duration bonds just as ‘risky’ as longer duration bonds, and require a higher yield.
There are a few interpretations of what an inverted yield curve actually means, but one is that interest rates will fall because the economy weakens. This interpretation, understandably, can make investors nervous.
US yield curve

The spread between 10 and 2 year yields has shrunk to its tightest this year, as you can see from the chart above, with the 10 year yield only about 10 basis points above the 2 year.
At Moneyfarm, we don’t actually believe there’s a mystical significance between a positive and negative spread, but we do believe the curve reflects expectations that US growth and inflation probably won’t accelerate in the short-term. And maybe that’s not so bad – after all the US economy is growing quite nicely, and generating jobs and wage growth.
It is worth pointing out, though, that the US yield curve has been relatively flat for several years now, even as economic growth has been decent. This could reflect demand for long-dated government bonds from pension funds or the impact of quantitative easing on the bond market. Whatever the reason, a flat curve hasn’t signalled slower growth so far in this economic cycle.
What does an inverted yield curve show?
Maybe the yield curve does reflect a slowing US economy, that maybe even at a faster rate than people thought. Yes, the US is still adding jobs, but the latest employment data has been slightly weaker than expected. The US economy outperformed European growth, particularly in Italy and Germany. And that’s already been reflected in financial markets.
As we noted before, the positive performance of global equities in the third quarter was largely thanks to the US, whilst short-term fluctuations paint a picture of rising concerns.
What should investors do?
The yield curve is a signal that’s worth paying attention to, although it definitely isn’t as predictive as many like to believe. It won’t cause a recession in the US, but it could well signal that US growth is weakening.
And that, among other things, could change the equation for the Federal Reserve next year (and maybe even in December) as it plots out its monetary policy plans.
If the curve doesn’t invert, the question of 2019 US economic growth doesn’t disappear. In fact, it’s likely to dominate the headlines for some time to come.
At Moneyfarm, our Investment Team monitors the financial markets, economic backdrop and geopolitical noise on your behalf, making necessary adjustments to portfolios to ensure they continue to reflect your appetite for risk.
The investment strategy is split into our strategic asset allocation, which looks over a long-term investment horizon, and our tactical asset allocation, which makes adjustments over the short-to-medium term.
The strategic portfolios are built with a 10-year view, as the Investment Team develop forecasts based on the global economy and financial markets. A lot can happen in a decade, and the journey is rarely smooth. Moneyfarm optimises the risk/return profile of our portfolios by placing a tactical overlay on the strategic outlook, known as Moneyfarm’s rebalancing process.
The Investment Committee meets every month to discuss market and economic trends, review risk management and volatility, and make tactical allocations where necessary.
If you have any questions about the work our Investment Team do or the Moneyfarm Investment Strategy, book a call with one of our Investment Consultants who will be in touch to discuss anything with you.


