Discussions about performance and how to measure it are normally left to those with specialised knowledge. Yet the way we calculate performance has a real impact on you, our customer, and the investment decisions you make in pursuit of your financial goals.
There are a number of different ways to measure performance, although there’s no one correct method alone. Here’s a quick guide to how we measure the performance of your portfolio at Moneyfarm.
Simple calculations
Strip out cash flows (both investments and withdrawals) and simple performance calculations compare the market value of your portfolio against its initial value.
Imagine you invested £10,000, which grew to £10,500 in one year. The performance of your portfolio is +5%. If you’d invested £10,000 and ended the period with £9,500, your performance would be -5%.
It’s certainly easier to understand simple calculations and use them to make comparisons between wealth managers, but introduce cash flows – both in and out of the portfolio – and the way you measure performance gets a bit more complicated.
In the example above, if you invest another £10,000 and the value of your portfolio becomes £20,500, the simple return falls to 2.5% without any market movement at all.
For a more accurate and fair representation of performance, wealth managers typically debate between two preferred measures; time-weighted performance and money-weighted performance.
Time-weighted performance
A time-weighted method of reporting strips out the impact of cash flows on performance. It does this by separating the reporting period into subperiods based on the timing of cash flows.
For example, if you invest £350 every month for a year, the annual reporting period would be split into 12 sub-periods. These sub-period performances would then be linked together to show an annual performance.
All reporting periods are treated equally in the time-weighted calculation, even if you invest different sized lump sums an an irregular basis.
By eliminating or reducing the impact of cash flows, time-weighted performance is preferred by many wealth managers who have no control over the cash flows of the individual investor. To them, it better reflects their ability. However for the individual investor this isn’t the whole picture.
Money-weighted performance
Another way to calculate performance is with a money-weighted calculation. This measure is seen as a more accurate picture of the true return you receive as an individual, as it includes individual cash flows within a period – whether dividends, account top-ups or withdrawals.
This measure of performance corresponds to a well-known concept in finance called the internal rate of return (IRR).
Investing or withdrawing from your portfolio impacts the performance number, especially during times of volatility. This means the performance figure of your portfolio is more exposed to your cash flows than the ability of your portfolio manager.
Does it matter how your performance is calculated?
During periods of volatility, it’s important investors understand how their performance is calculated. Different reporting styles can show significant differences during periods of volatility or if there’s a large cash flow during a reporting period.
Understanding this and looking at the whole performance picture can help investors avoid any ill-timed knee-jerk reactions that can be more detrimental to portfolio performance over the the long run.
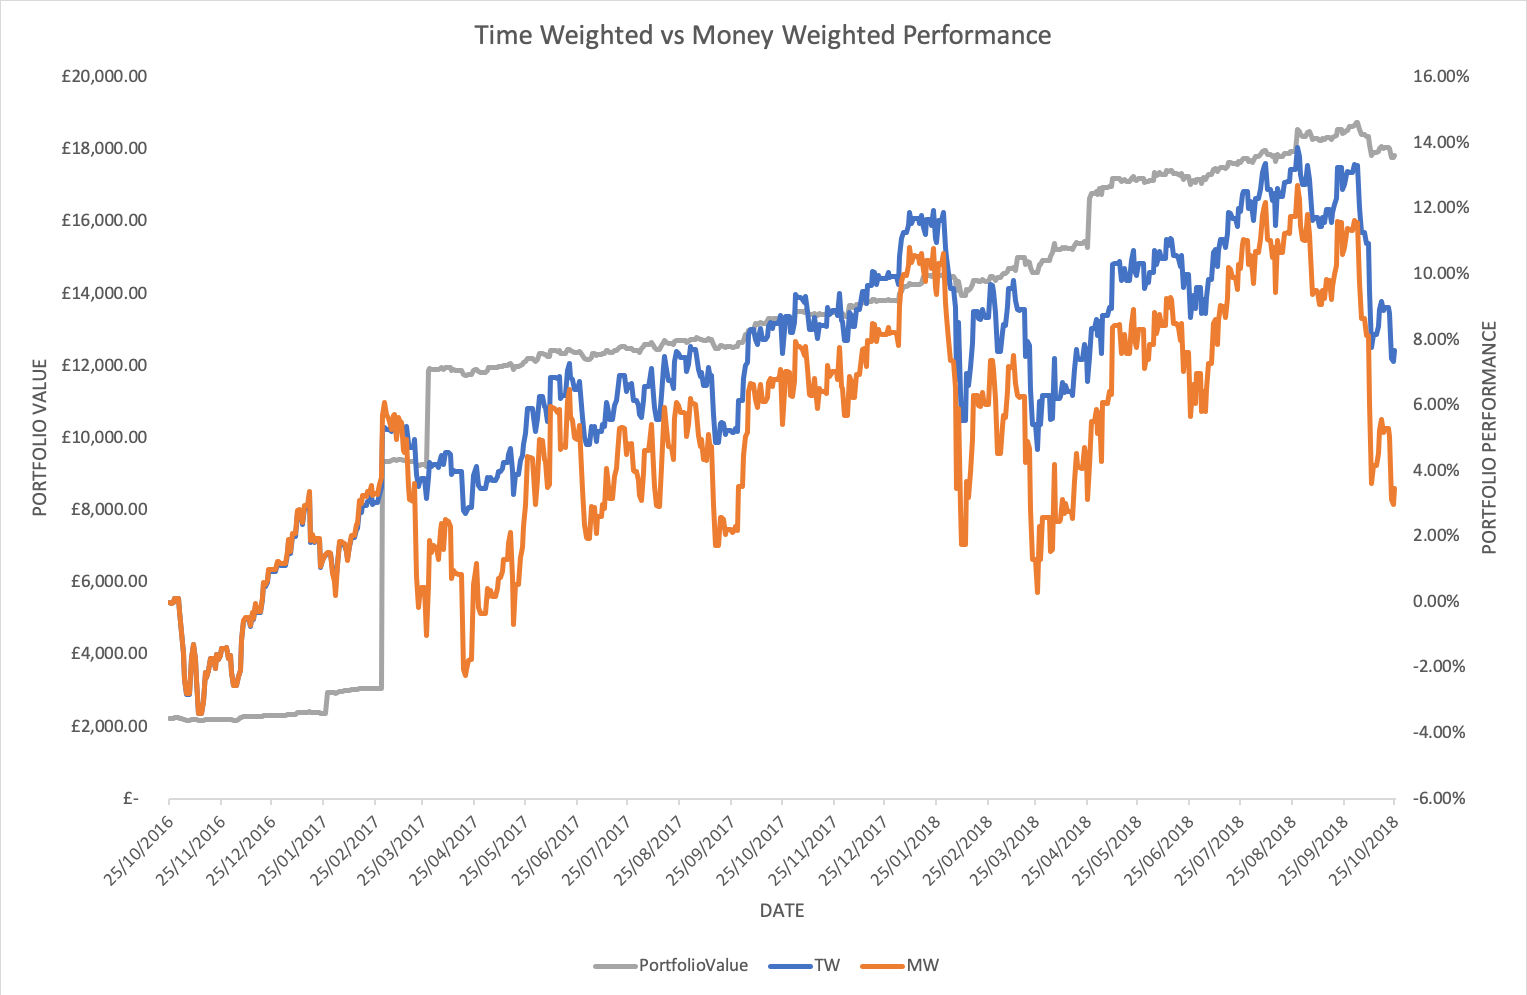
The chart below shows just how significant this difference between time-weighted (blue line) and money-weighted (orange line) can be, especially when compared to the portfolio value (grey line).

In the first few months of this reporting period, performance of both money-weighted and time-weighted performance are nearly identical. Two large inflows in the beginning of 2017 cause this to change quite quickly.
You can see periods of volatility are exacerbated in the money-weighted calculation. Whilst the time-weighted figure is also impacted, it’s not as severe as the money-weighted measure, which falls from nearly 12% to 3% during market volatility.
Crucially the portfolio value doesn’t react as violently to market volatility. Importantly, this is disguised by the swings in performance measures.
At Moneyfarm, we currently use money-weighted Performance as we believe this provides you with a fair reflection of what’s happening to your money. But we’re committed to providing you with a transparent picture of how your investments are performing, and are working towards providing multiple methods of performance calculation on the dashboard in the future.
Volatility can be unnerving if you’re not invested in the right way for you. Remember, it’s a normal part of the financial markets and is the dynamic that gives investors the opportunity to grow money in the first place.
Investment advice ensures your investments are suitable your risk appetite. If your portfolio reflects you and your time horizon, stick to your long-term strategy and avoid reacting to any short-term fluctuations. If you have any questions about recent performance, book a call with one of our Investment Consultants who will be in touch soon.
If you have any feedback about the way we show the performance of your portfolio, please get in touch at hello@moneyfarm.com.


