


After the market volatility of the past couple of weeks, we wanted to take a look at the recent macro data to understand how it changes the overall picture.
To take a step back, equity markets sold off on concerns, in part, that the US economy was slowing faster than expected and that the US Central Bank should already have started to lower interest rates.
That broadly left us with two questions. First, would we see signs that the economy was slowing faster than expected? Second, would inflation data prove low enough to allow the Fed to cut rates at its September meeting?
The short answer is that at least some of the macro data has proven better than expected, while the inflation figures have at least been in line with analyst expectations. So, the probability of an imminent recession has fallen, at least this week. At the same time, we think that the Fed should be comfortable cutting rates next month by 25 bps, although perhaps not by the 50 bps that some are calling for.
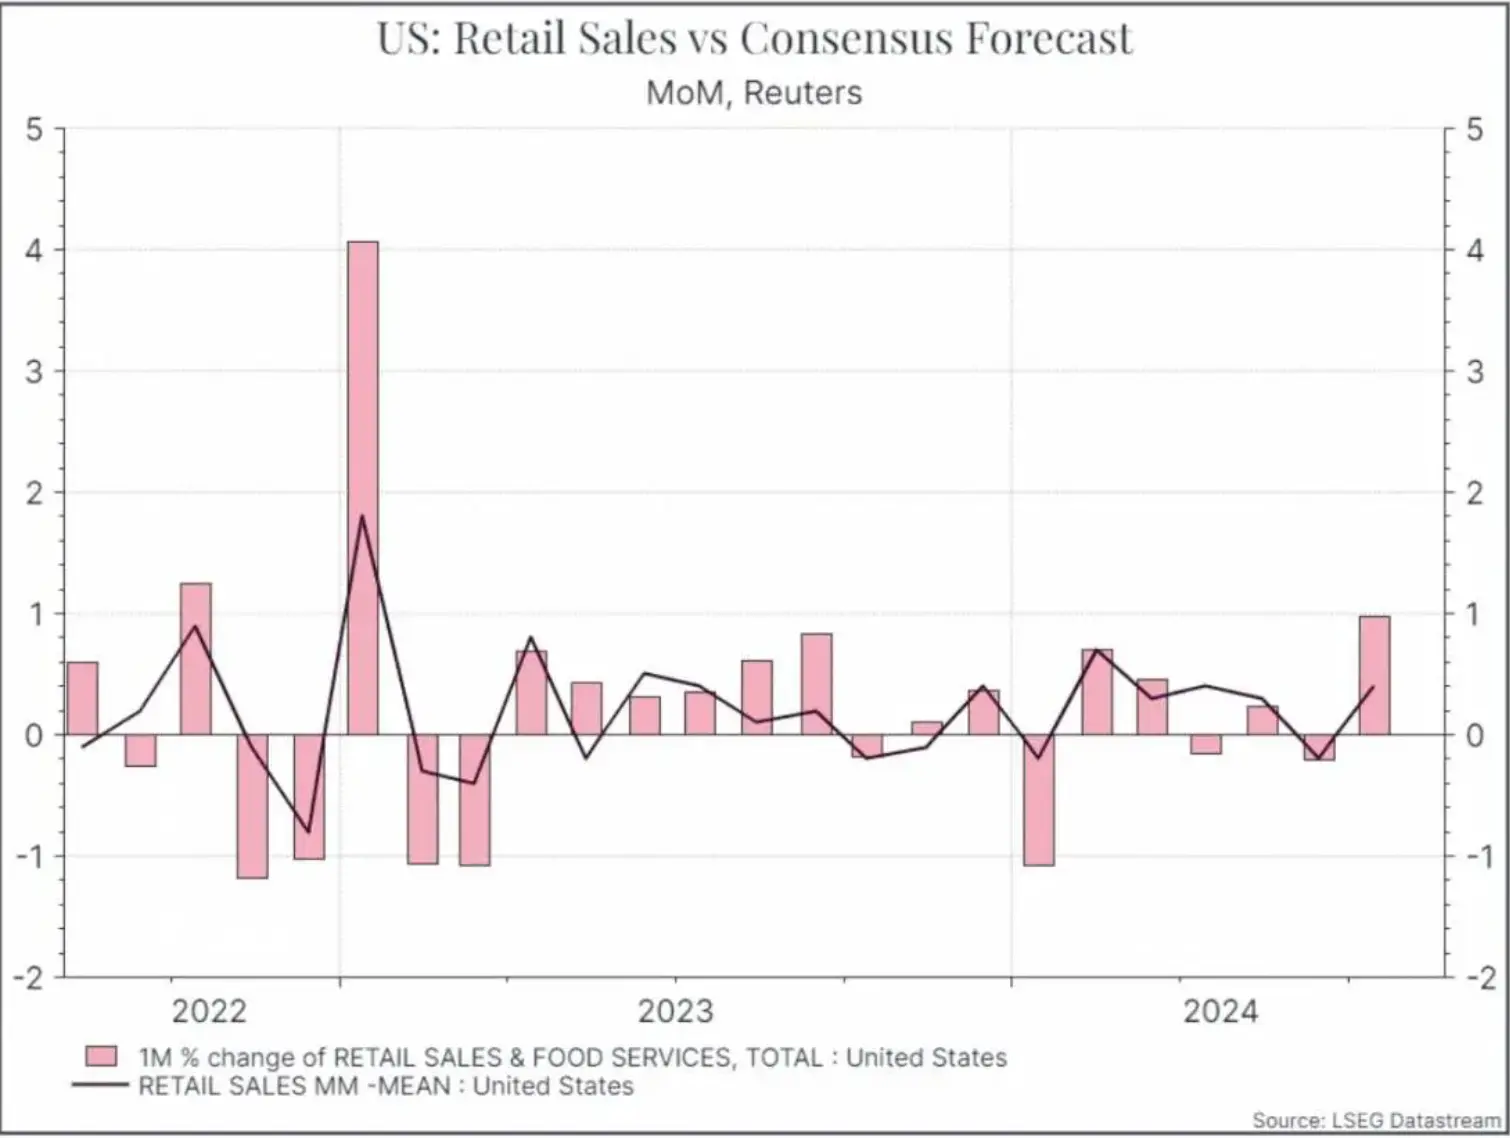
Let’s dig into the details a bit more. On the positive side, we’ve seen July US retail sales come in stronger than expected. The chart below shows monthly sales growth (the bar) compared to analyst expectations (the line).
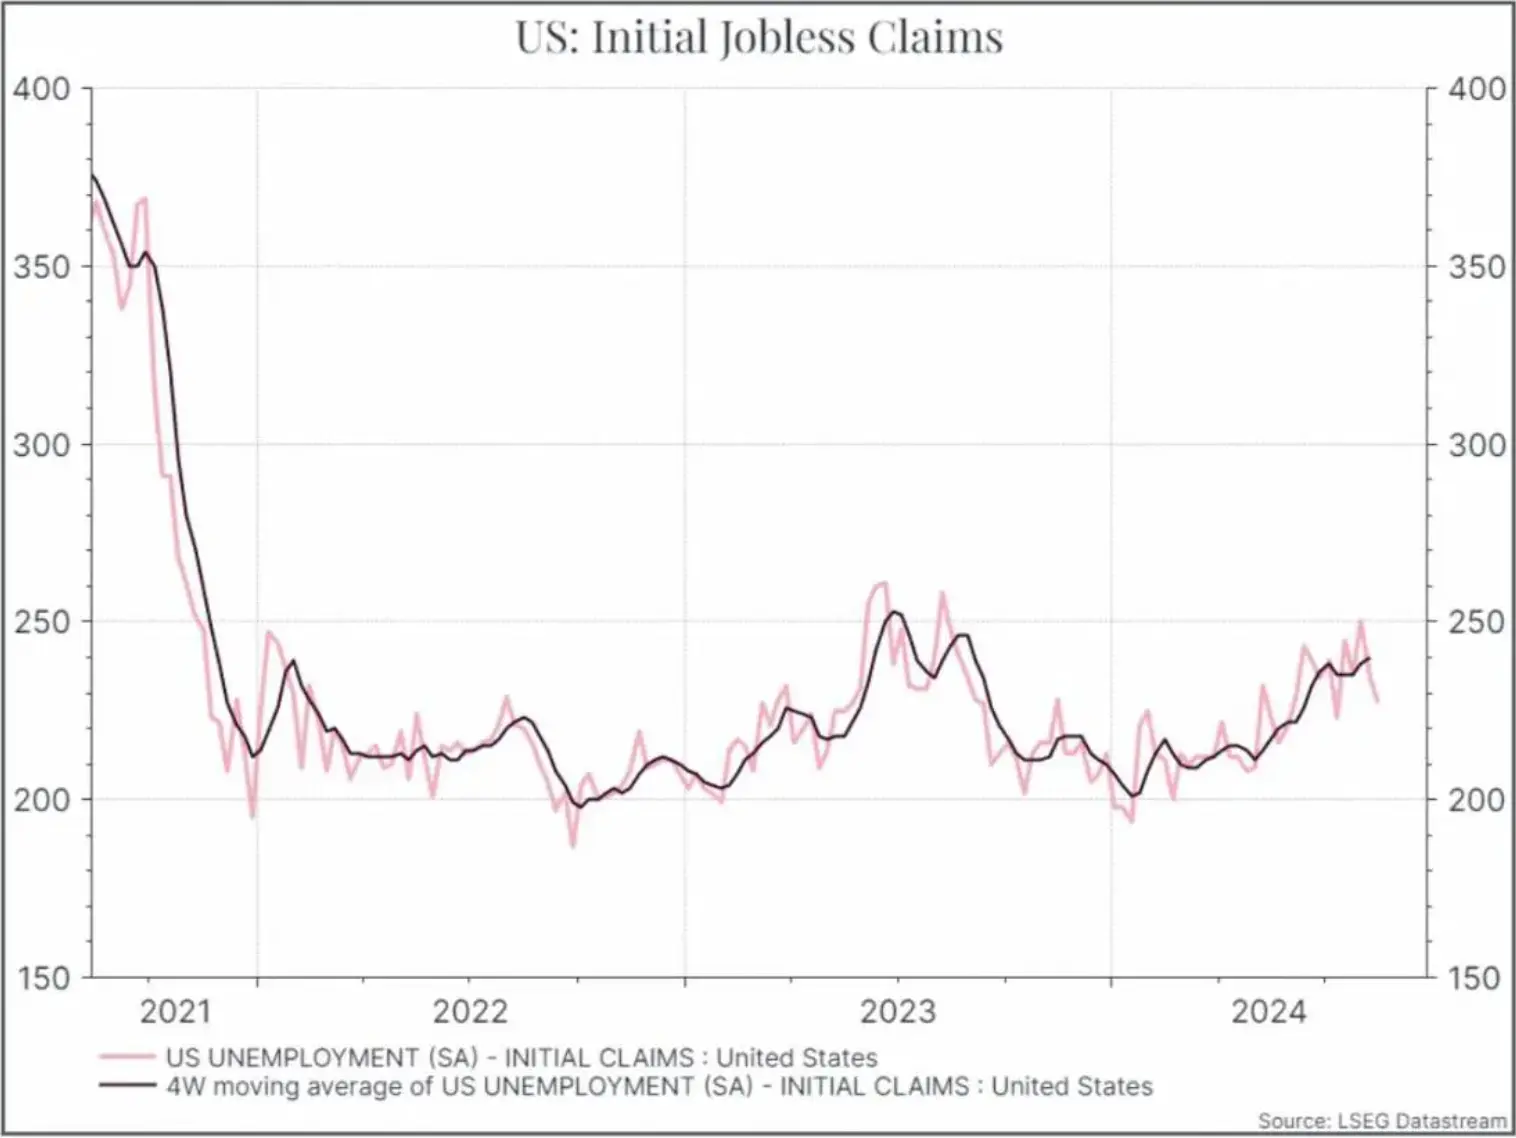
At the same time, the weekly initial jobless claims data remains within a fairly tight range as it has done since the start of 2022, while continuing claims also came in slightly below forecasts. It suggests to us that the US labour market is cooling, but not at a pace that should cause us particular concern.
On the inflation side, both producer and consumer prices were moving in the right direction, at least at the headline level.
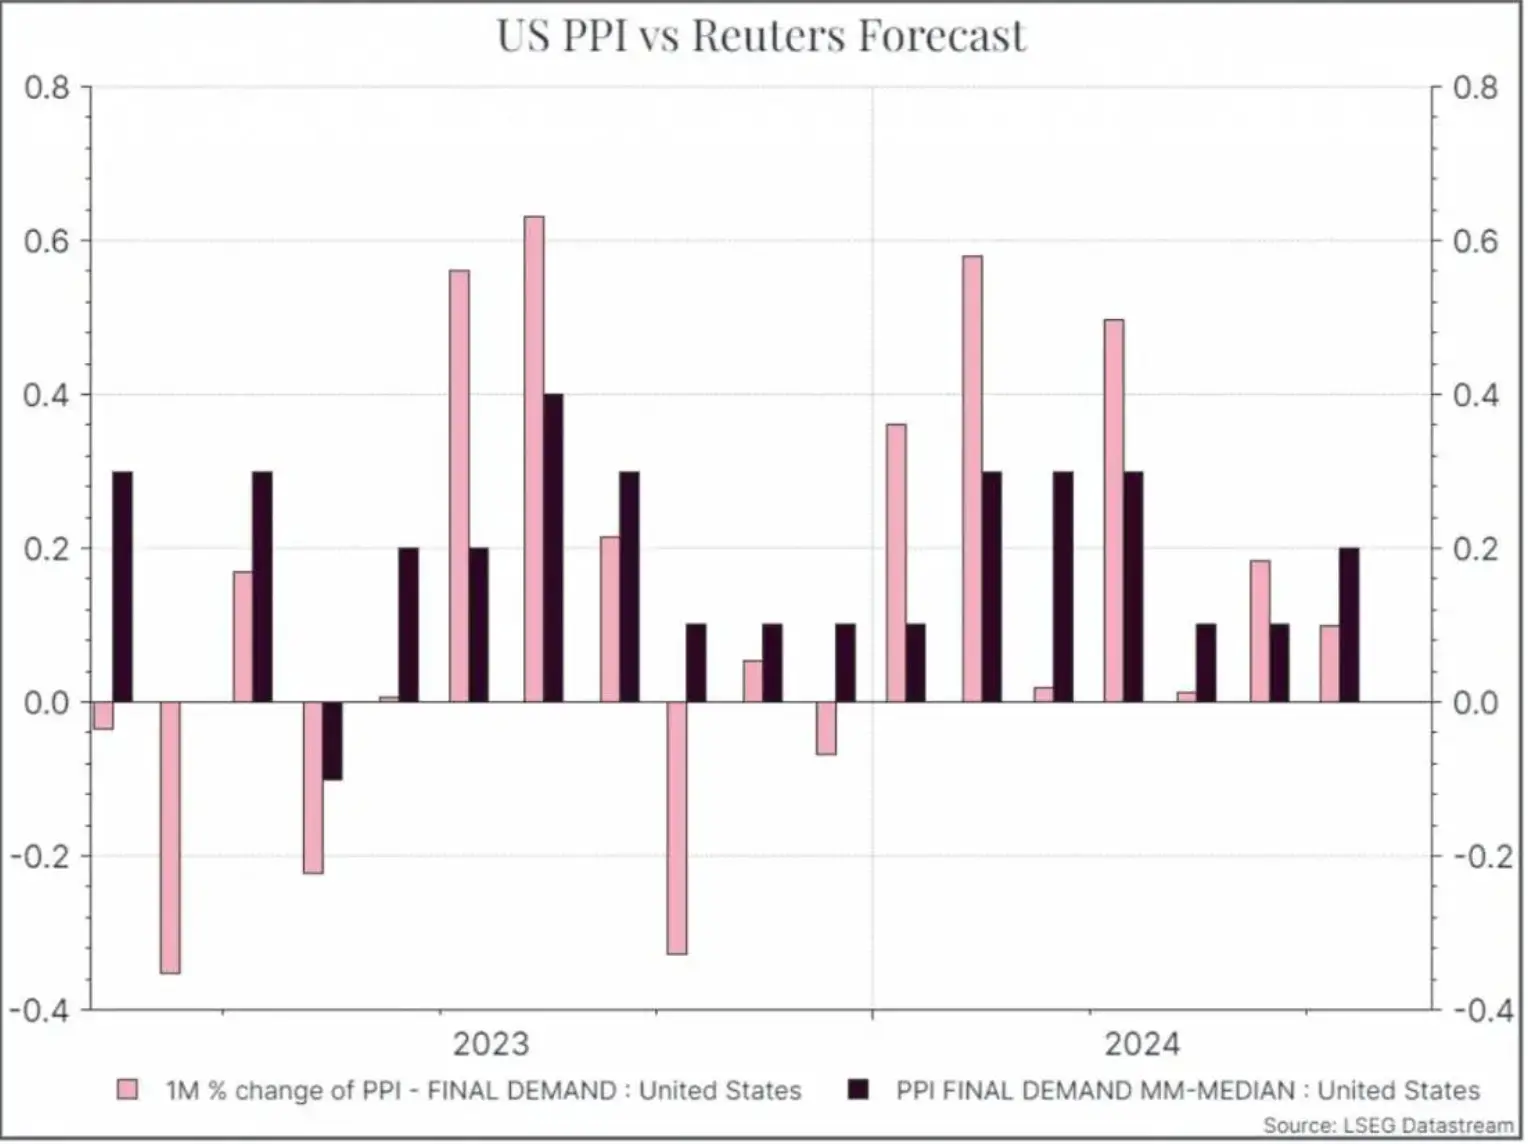
US producer prices rose by less than expected last month. The chart below shows the monthly increase in the producer price index (the light-coloured bar) compared to the Reuters consensus forecasts (the dark bar).
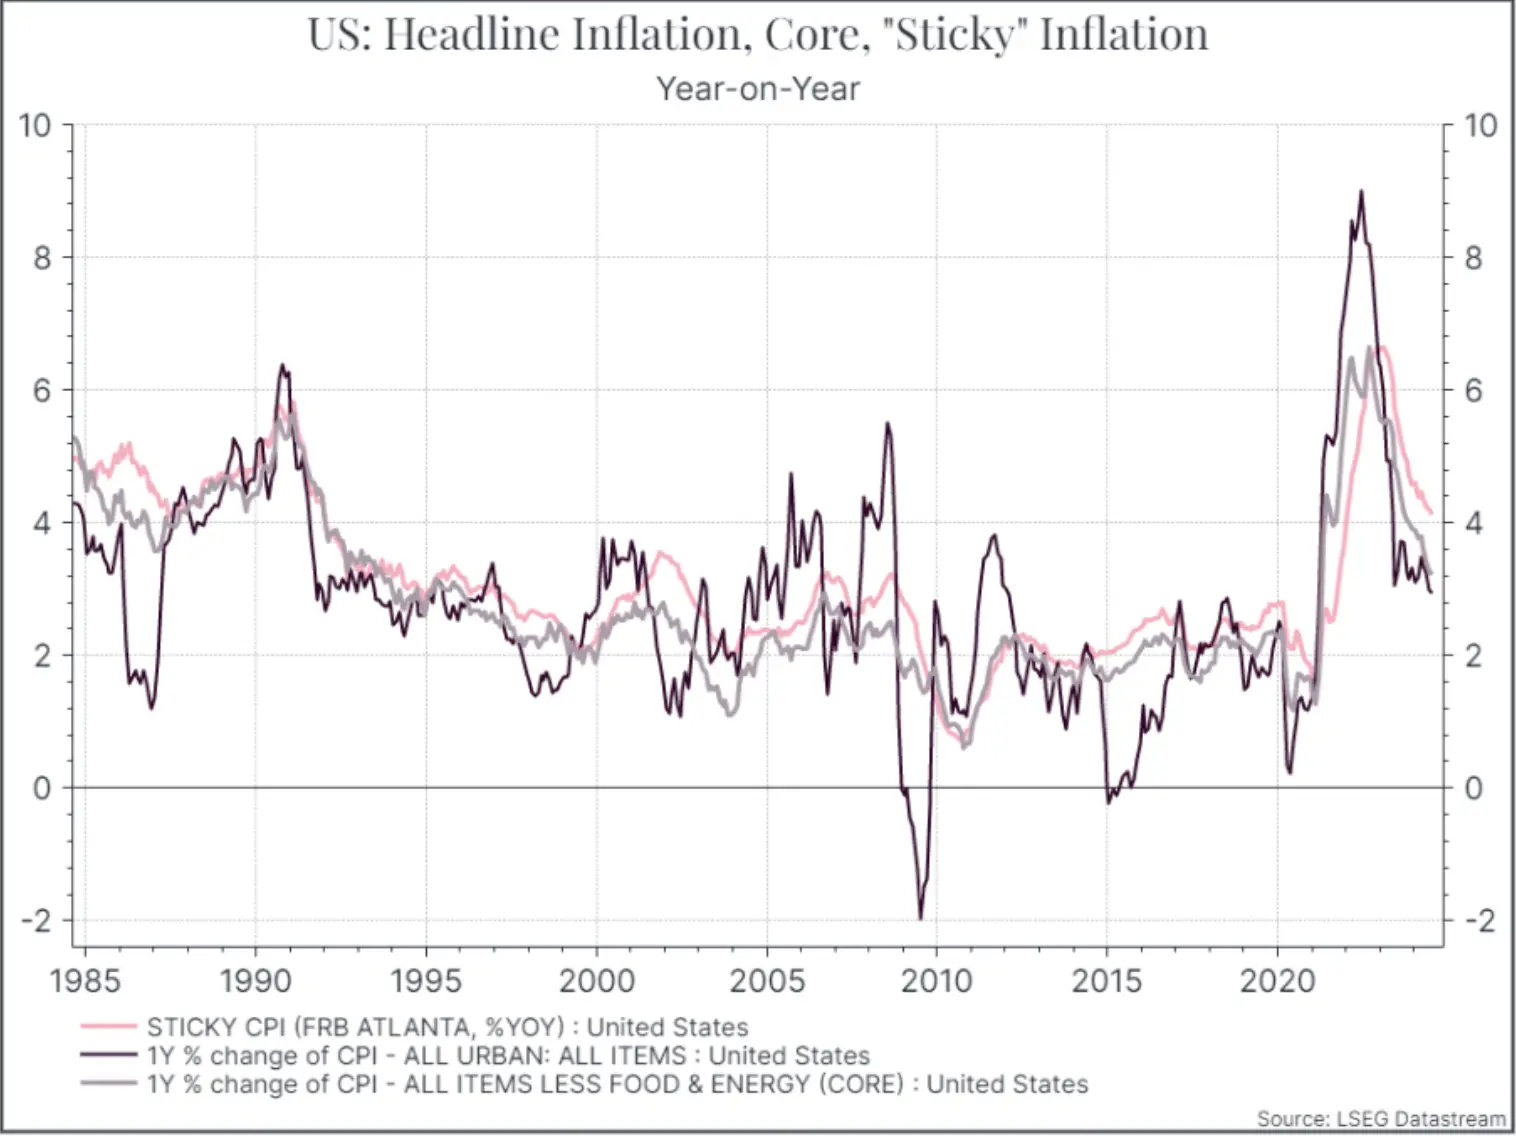
US consumer price inflation for July came in largely as expected. Headline inflation is now slightly below 3% year on year, technically within the range that the US central bank targets (2% plus or minus 1%). It’s not quite where the Fed would like it to be, but moving in the right direction. As the chart below shows, other measures like core inflation (excluding food and energy) and “sticky” inflation (a measure of prices that move less easily) are still a bit higher than 3%, but are moving towards the Feds targets.
Time for a few caveats. First, it’s a small number of data points, so hardly conclusive. Second, as you’d expect, not all the data that we’ve seen in the past couple of weeks tells a positive story. The housing component of consumer prices was higher than expected and the drop in PPI was really thanks to one component. Sentiment indicators from the manufacturing sector continue to suggest that manufacturers in the US face a challenging environment.
But we’d argue that the US data we’ve seen since the most recent recession scare suggest that the US economy isn’t ready to tip into recession and that inflation has fallen enough to warrant a rate cut in September. For now, we think that’s a pretty good outcome.
*As with all investing, financial instruments involve inherent risks, including loss of capital, market fluctuations and liquidity risk. Past performance is no guarantee of future results. It is important to consider your risk tolerance and investment objectives before proceeding.